Dashboard
After logging in you land on the Dashboard: the overview with the key metrics for the selected environment. At a glance you can see which jobs are running, which errors have occurred recently, and how the loads are doing per source system. Click the logo in the top left (this can be your own company logo) to return to this Dashboard from any screen.
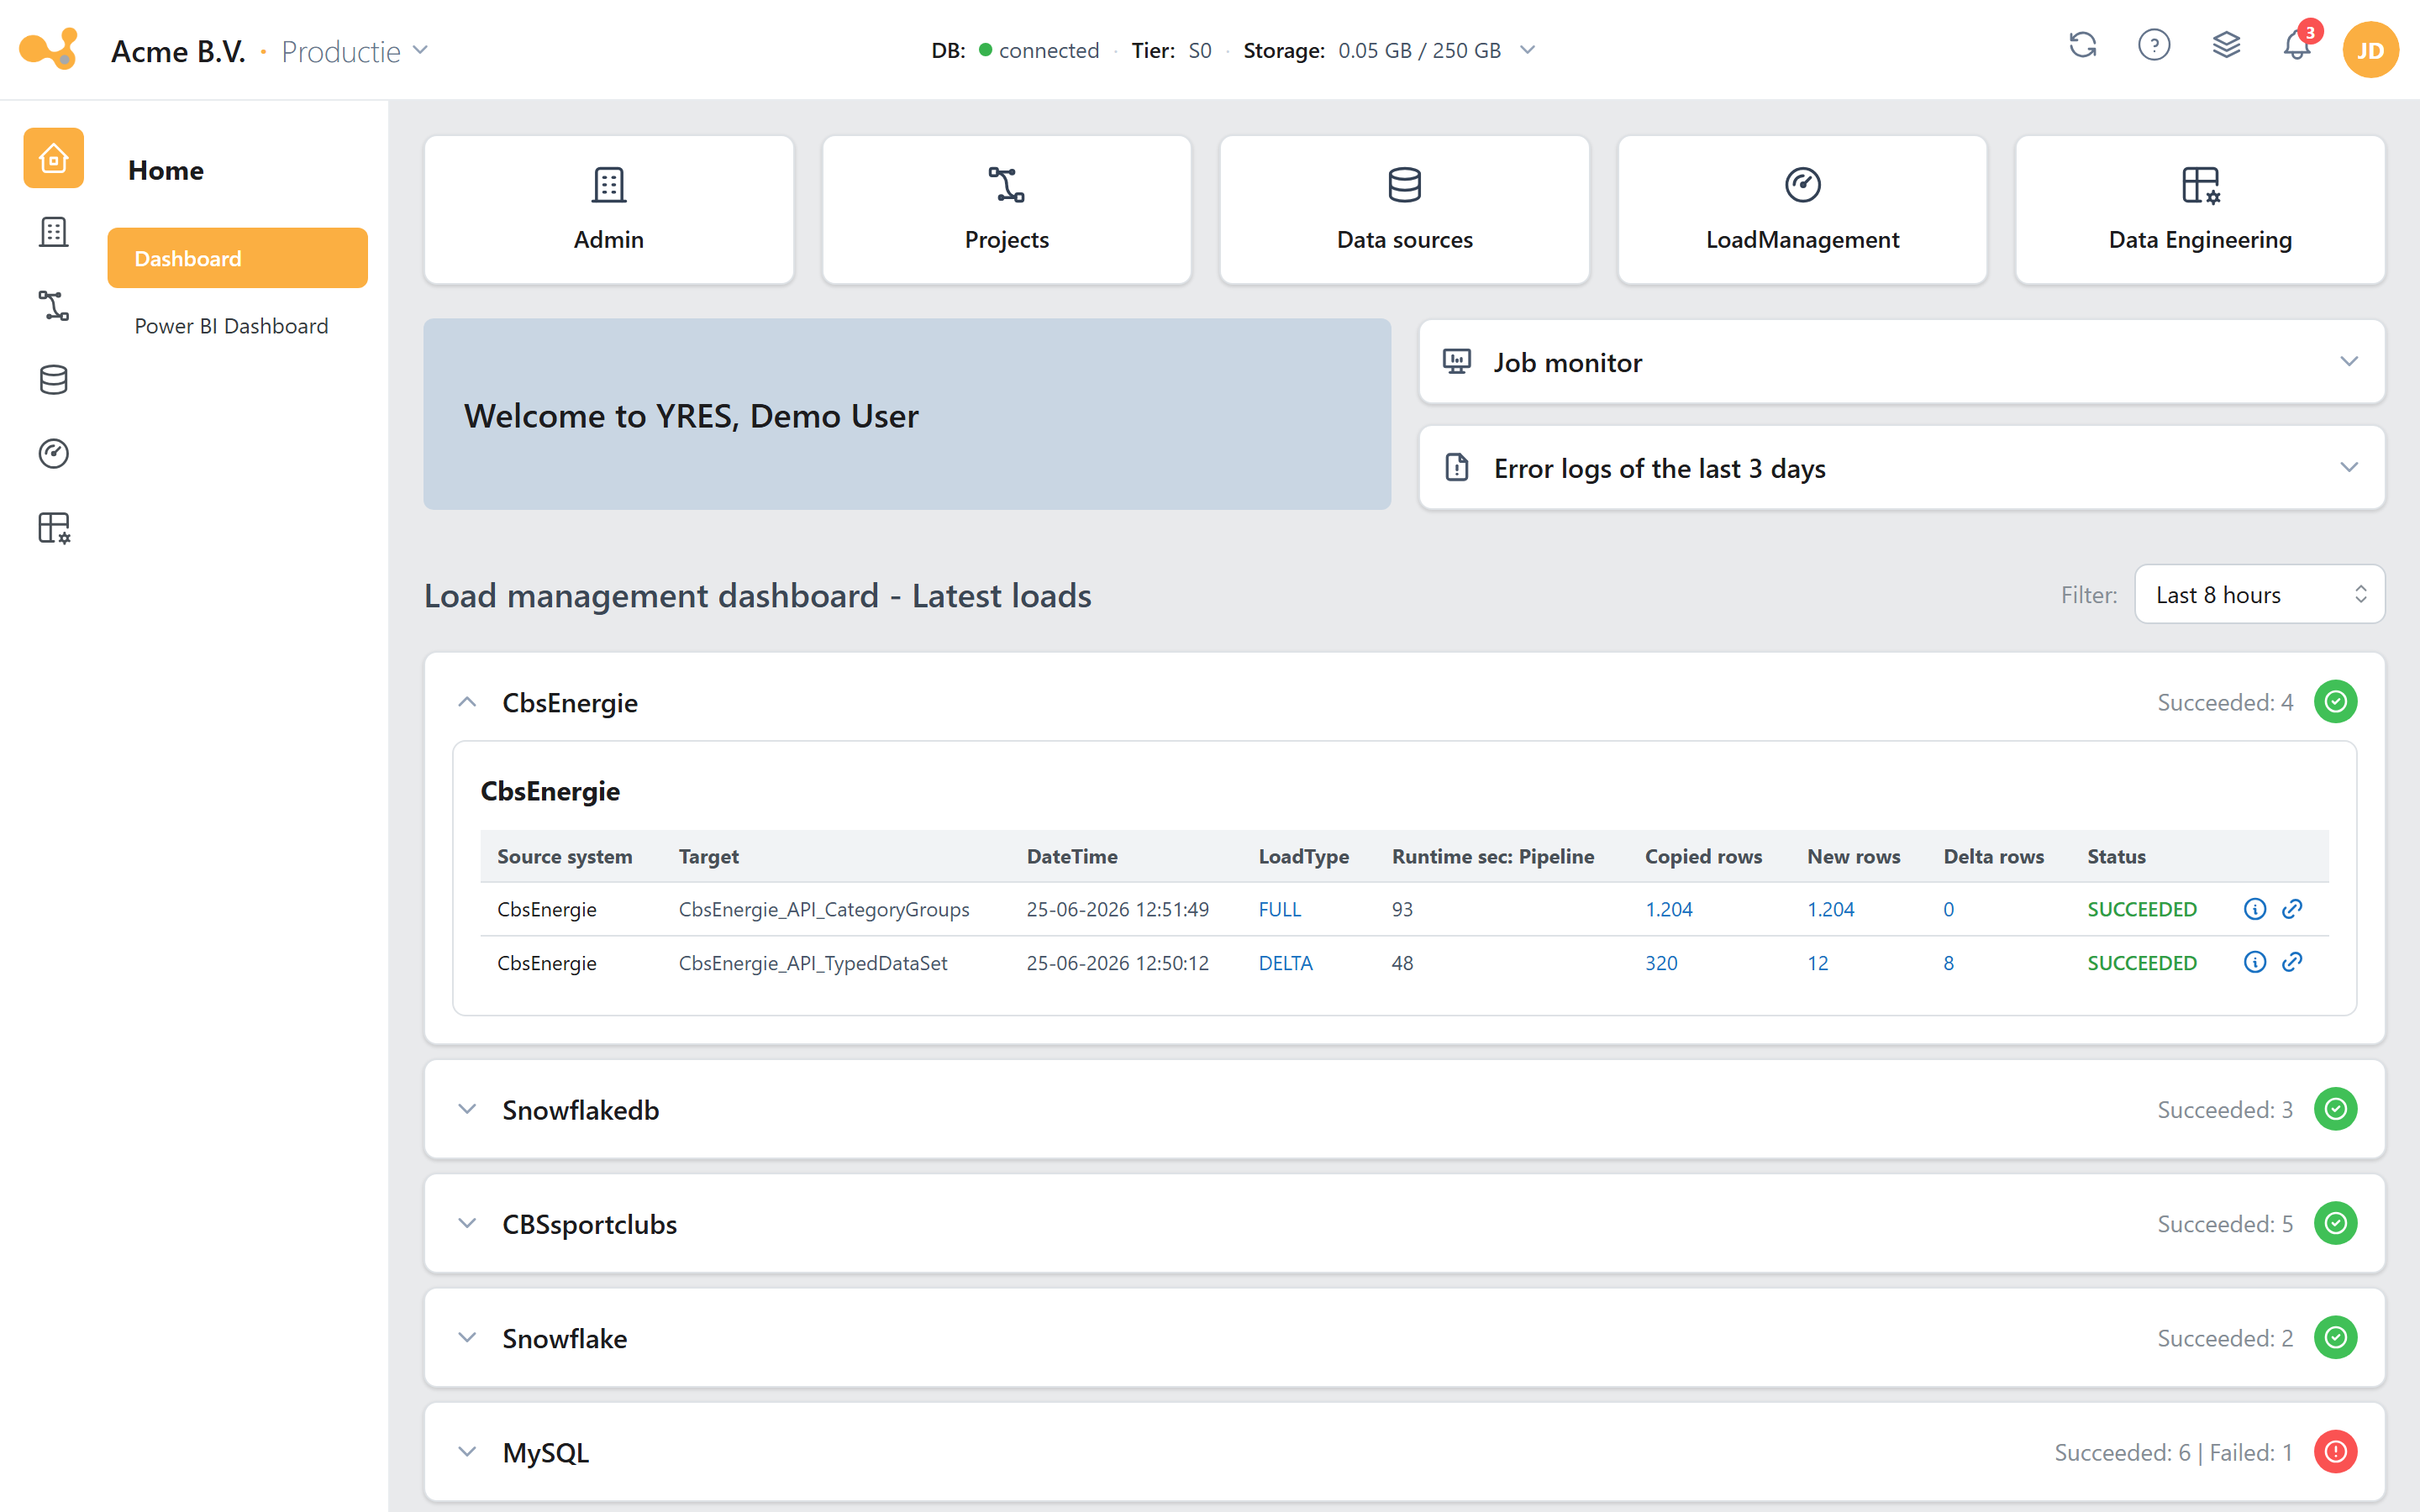
The numbers in the screenshot (1)–(6) refer to the components below:
- Quick-nav tiles (HomeNav) — shortcuts to the main sections (Admin, Projects, Data sources, Load management, Data engineering). Tiles are hidden based on your permissions and when an organization has a single environment.
- Welcome block — a greeting with your name and the active environment.
- Announcements — messages from your admin as well as general announcements from Yres.
- Monitored jobs — an expandable panel showing the running and recently finished jobs in this environment.
- Error logs (3 days) — an expandable panel with the database errors from the last three days; the badge shows the count.
- Load history — load history grouped per source system, expandable to the detail rows.
Components
| Component | What you see |
|---|---|
| Jobs (Monitored jobs) | The running and recently finished jobs in the selected environment, with status. Actions performed by ADF include a direct link to the ADF monitor. |
| Error logs (3 days) | All database errors from the last 3 days — for example when creating tables, installing changes, updating sources, and the detailed load steps. |
| Announcements | Messages from your admin as well as general announcements from Yres (releases, downtime, other information). |
| Load statusses | Loads grouped per source system; only the latest result is shown per source object. The period can be set in the top right. The log icon (ⓘ) opens the detail steps, and the link icon (↗) jumps to the ADF monitor. |
| Non-source-specific processes | Data processes that are not tied to a single source system, such as loading Power BI models and writing views to tables. |
| PowerBI Model refreshes | The status of model refreshes. |
| Persisted Views | The status of persisted views. |
Under Load statusses you see only the most recent load per source object. The full history of earlier runs is available via the log icon (ⓘ) and on the Monitoring screen under Load management.
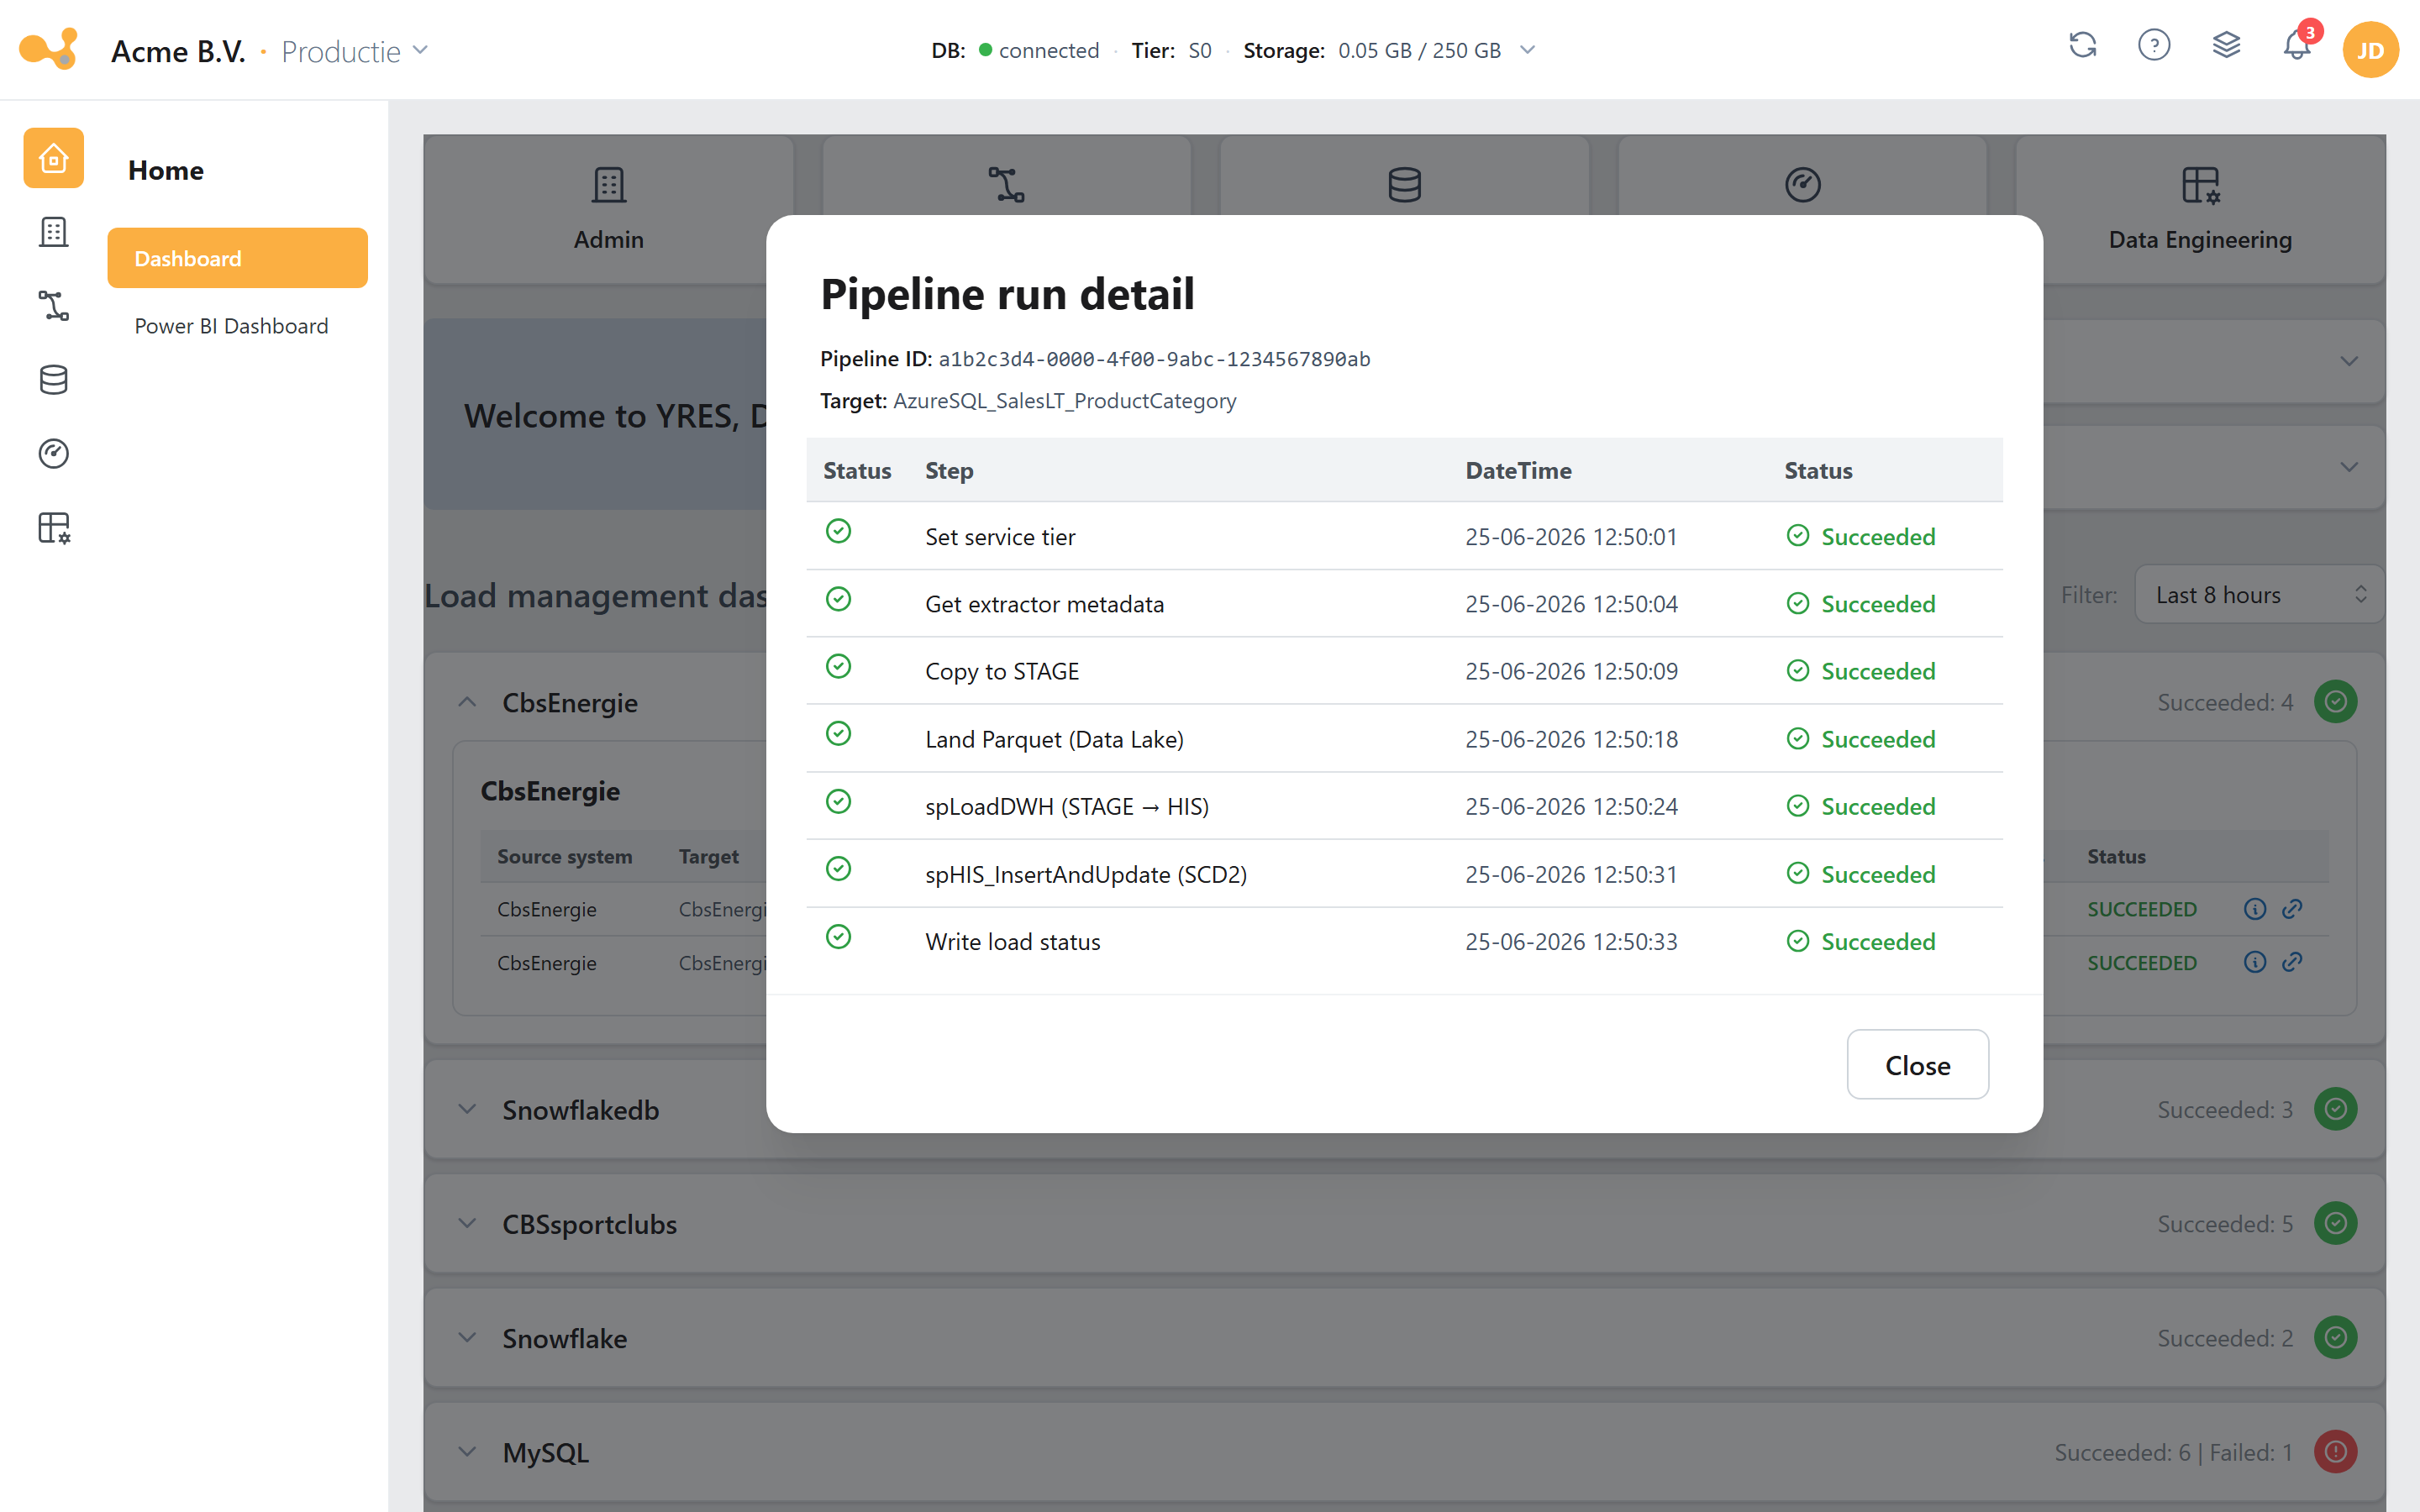 Pipeline run detail — click the log icon (ⓘ) on a load to see the status and timestamp per step.
The shared chrome (header, icon rail, sub-links)
Every signed-in screen — not just the Dashboard — is framed by the same three navigation elements: the top bar, the icon rail on the left (the sections) and the contextual sub-links next to it.
The numbers (1)–(6) in this screenshot:
- Logo + organization title — click the logo to return to the Dashboard (
/). - Environment switcher — shows the organization name, a
·separator and the active environment (e.g. Acme B.V. · Production). Only shown when there is more than one environment. - Help "?" — opens the wiki at
wiki.yres-dwh.app. - Icon rail (sections) — Home, Admin, Projects, Data sources, Load management, Data engineering. Visibility depends on your permissions and on the DWH version; Projects is hidden for an organization with a single environment.
- Sub-link sidebar — the contextual links for the selected section (for Home: Dashboard and Power BI dashboard). The sidebar can be resized by dragging.
- Actions in the top right — refresh, monitored jobs, notifications and the user menu.
In the Admin section a red badge with the number of DWH errors appears next to DWH logs as soon as there are errors. On the Dashboard itself you see the same count on the Error logs (3 days) panel.
Switching environments
Does your installation have multiple environments? Switch between them using the environment switcher in the top right of the top bar. The active environment — Development, Test or Production — has been displayed prominently next to the organization name, separated by a ·, since v1.53.
How to switch environments:
- Click the environment switcher in the top right (the pill with organization · environment ▾).
- Choose the desired environment from the list.
- The screen reloads the data for the chosen environment; the title and metrics update accordingly.
The environment switcher only works on screens where environment-specific data is meaningful (such as the Dashboard, Data sources, Run pipelines, Monitoring and the DWH logs). On other screens the switcher falls back to Development and is disabled. For an organization with a single environment the switcher does not appear at all.