Load Management
In Load Management you control how data is loaded: start pipelines manually, schedule them with triggers, monitor their execution (including rolling back and resetting) and build your own flows with master pipelines.
The section has its own sub-sidebar with two groups: Load management (Run pipelines, Design master pipeline, Triggers, Integration runtimes) and Database monitoring (Monitoring, DWH processes, DWH queries).
The full list of screens with their route and fields is in Webapp screens.
Run pipelines
Route: /loadmanagement/runPipelines
Manually start a pipeline: load a table, fetch metadata, materialize a view or run your own ADF or master pipeline. On the left is the pipeline list (PipelineList); on the right are the runs of the selected pipeline, with filters for period and status. Custom ADF pipelines and master pipelines also appear in this list.
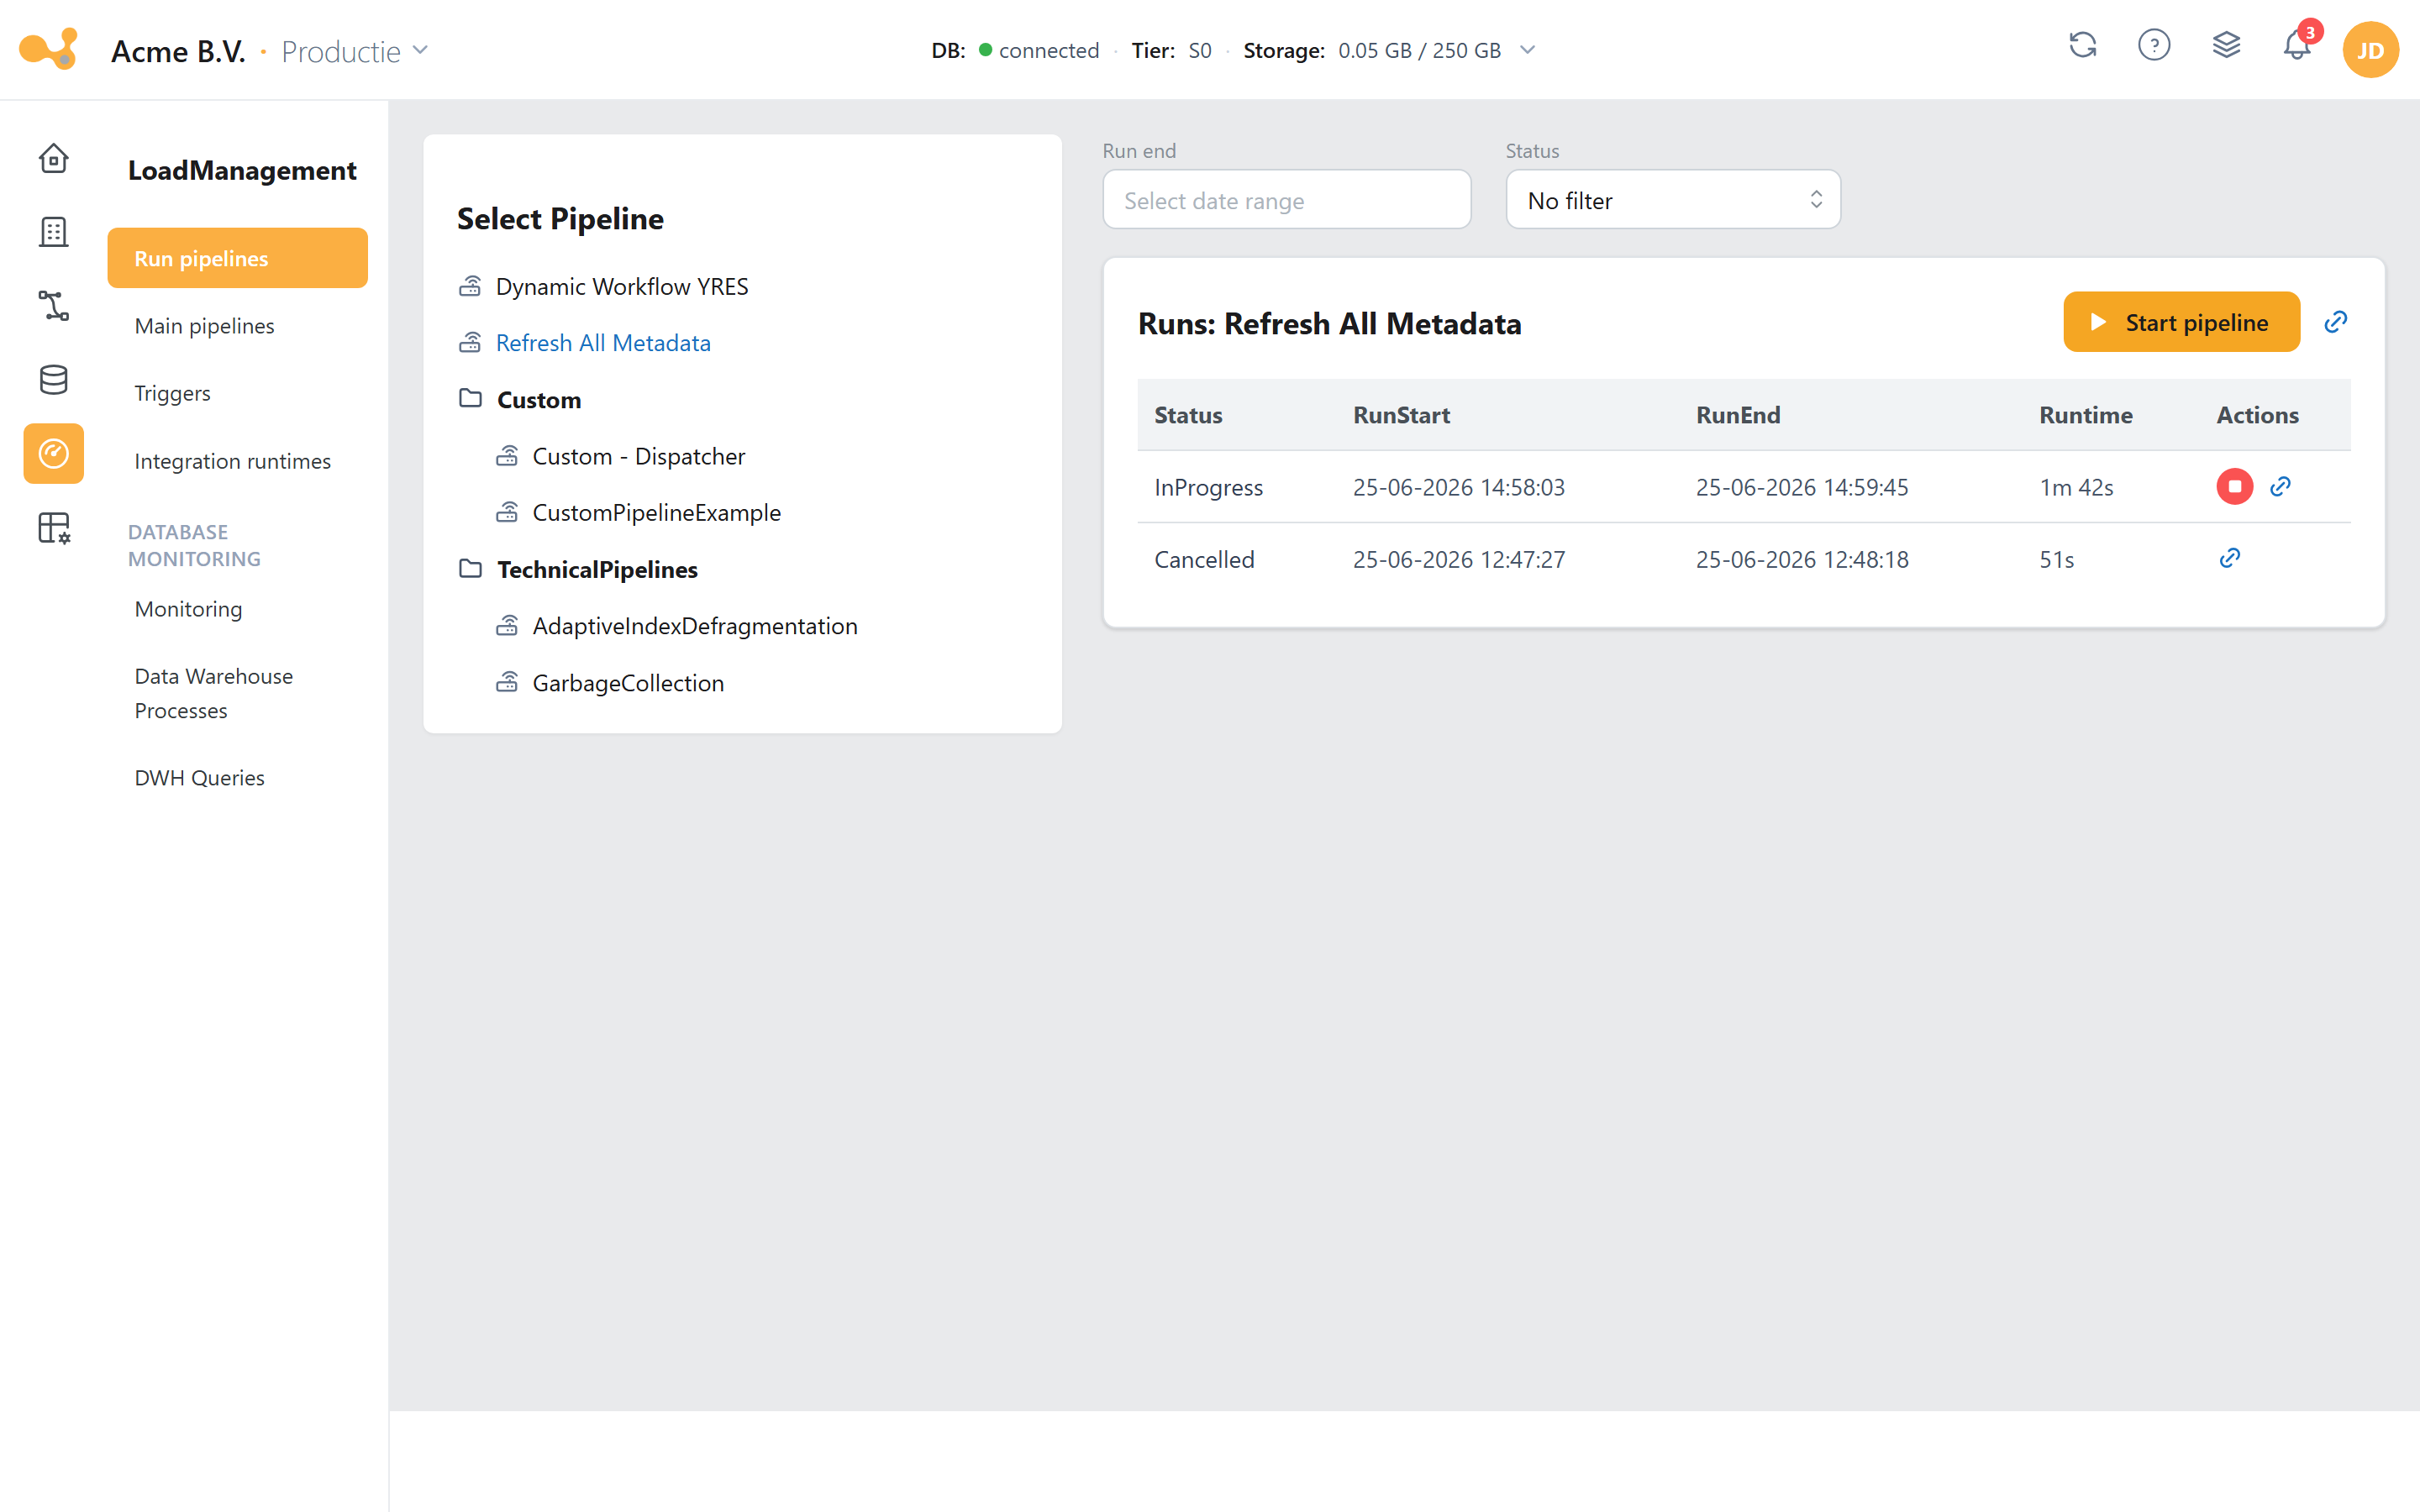
The Run pipelines screen: pick a pipeline on the left, filter the runs by period and status, and start the pipeline at the top right.
(1) Pipeline list on the left — select the pipeline you want to run or inspect.
(2) Date filter (runEnd) — limit the displayed runs to a period.
(3) Status filter (No filter / Succeeded / InProgress / Failed / Cancelled). For the Dynamic Workflow YRES pipeline, three additional cascading filters appear: Source → Schema → Table.
(4) Runs table showing, per run, the status, runStart, runEnd and the computed runtime (Xh Ym Zs).
(5) Per-run actions — link to the ADF monitoring, view error (red i icon when there is an error message) and stop pipeline (for InProgress/Queuing/Queued).
(6) Start pipeline — if the pipeline has parameters, the button reads Set parameters to start and opens a form where you enter Source/Schema/Table and, optionally, the service tier.
Starting a pipeline manually
- Select the pipeline on the left (for example Dynamic Workflow YRES).
- Click Start pipeline or Set parameters to start.
- If prompted, enter Source / Schema / Table and optionally choose a Running tier and Revert-to tier.
- Confirm. The run appears in the runs table; on failure, open the error message via the red
iicon and jump through to the Data Factory monitoring via the ADF link.
You can stop a running run via the stop icon. The actual loading happens in Azure Data Factory: the pipeline copies the source into STAGE and then calls [LoadManagement].[spLoadDWH]; progress is logged via [Monitoring].[spWriteLoadStatus].
Triggers
Route: /loadmanagement/triggers
Schedule a pipeline with a recurrence pattern (an ADF schedule trigger). For each selected pipeline you see the existing triggers; you can start, stop, delete and create them.
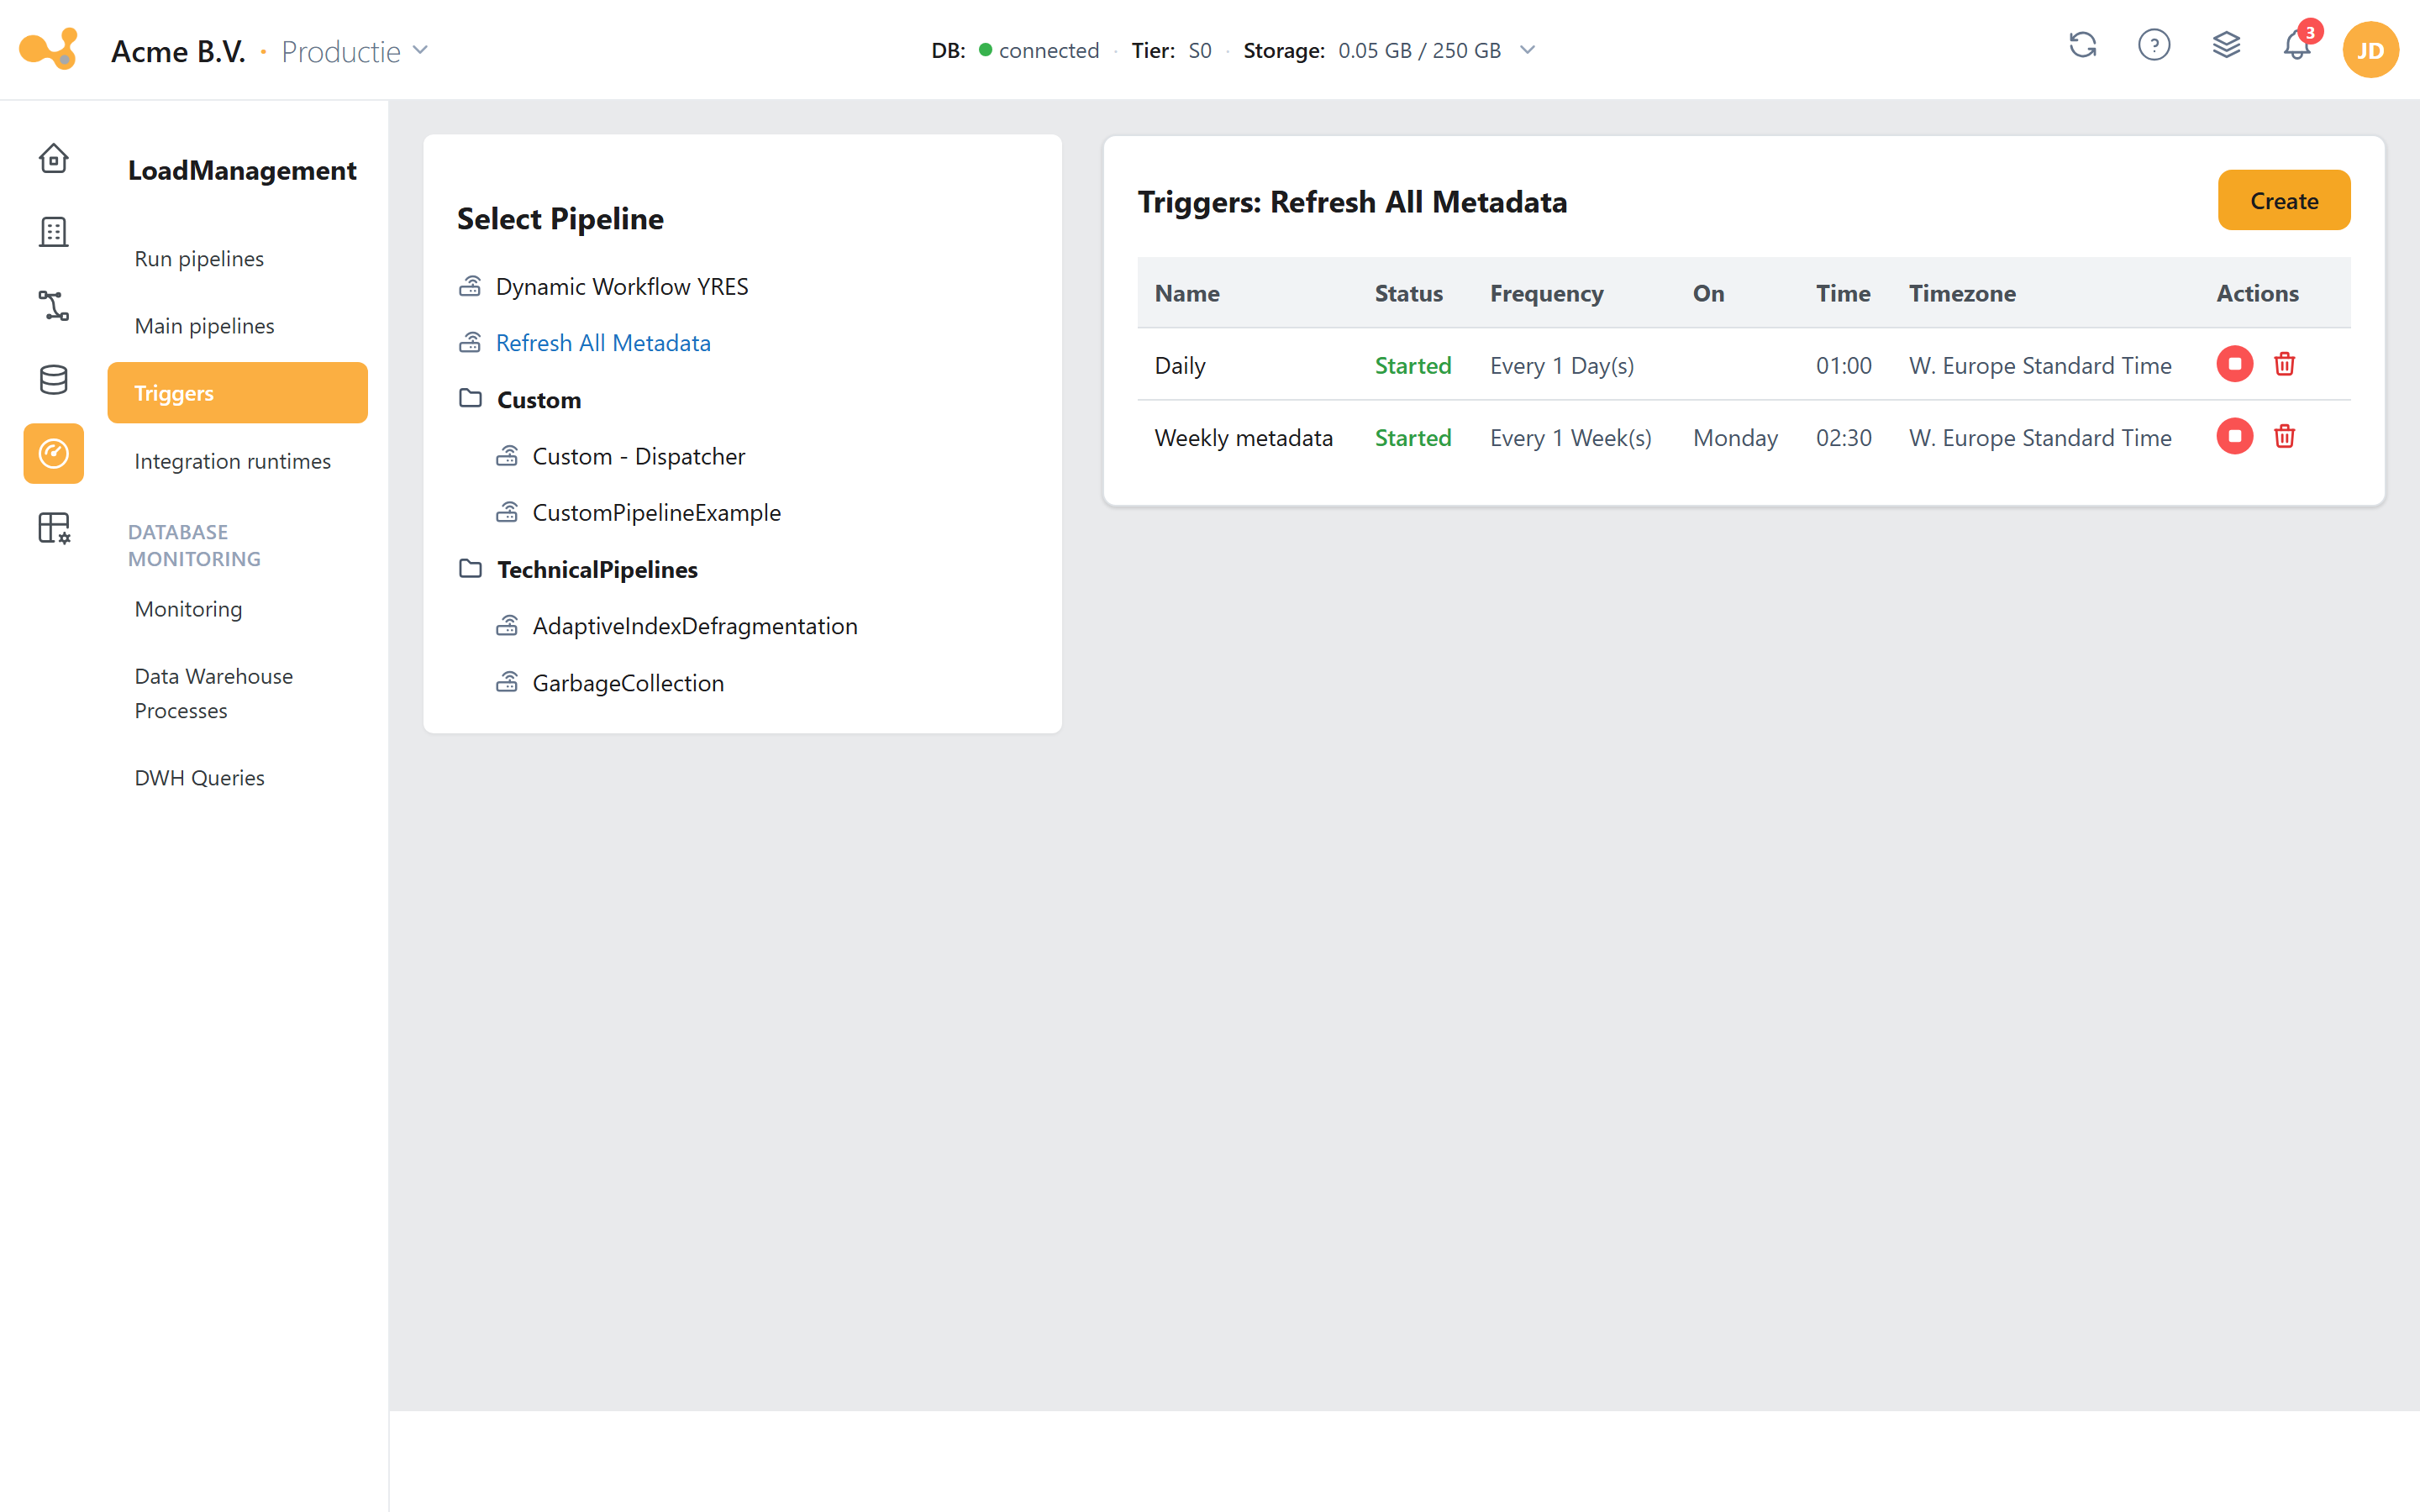
The Triggers screen: pick a pipeline, review the existing triggers, and schedule a new one with Create.
(1) Pipeline list on the left — select the pipeline whose triggers you manage.
(2) Triggers table with columns Name, status, frequency, on, time, timezone.
(3) Start ▶ / Stop ■ — turn a trigger on or off.
(4) Delete — remove a trigger.
(5) Create — opens the scheduling wizard.
(6) Info — for triggers with parameters (for example the Dynamic Workflow with Source/Schema/Table).
Creating a trigger
- Select a pipeline on the left.
- Click Create.
- Enter Name, Every / interval and Frequency (
Minute(s),Hour(s),Day(s),Week(s),Month(s)). For Week(s) you choose a Day of the week, for Month(s) a Day of the month (1–31), and for Day/Week/Month a Time. - If the pipeline has parameters, enter Source/Schema/Table in the second step.
- Click Submit.
The interface shows the hint "Timezone UTC(+1) will be used", but the trigger actually uses the timezone of the logged-in user (from your user settings), not a fixed UTC+1.
Integration runtimes
Route: /loadmanagement/integration-runtimes
Manage the Data Factory integration runtimes: the compute environments in which pipelines run. The list shows, per runtime, its type and running status, with a Create action to add one.
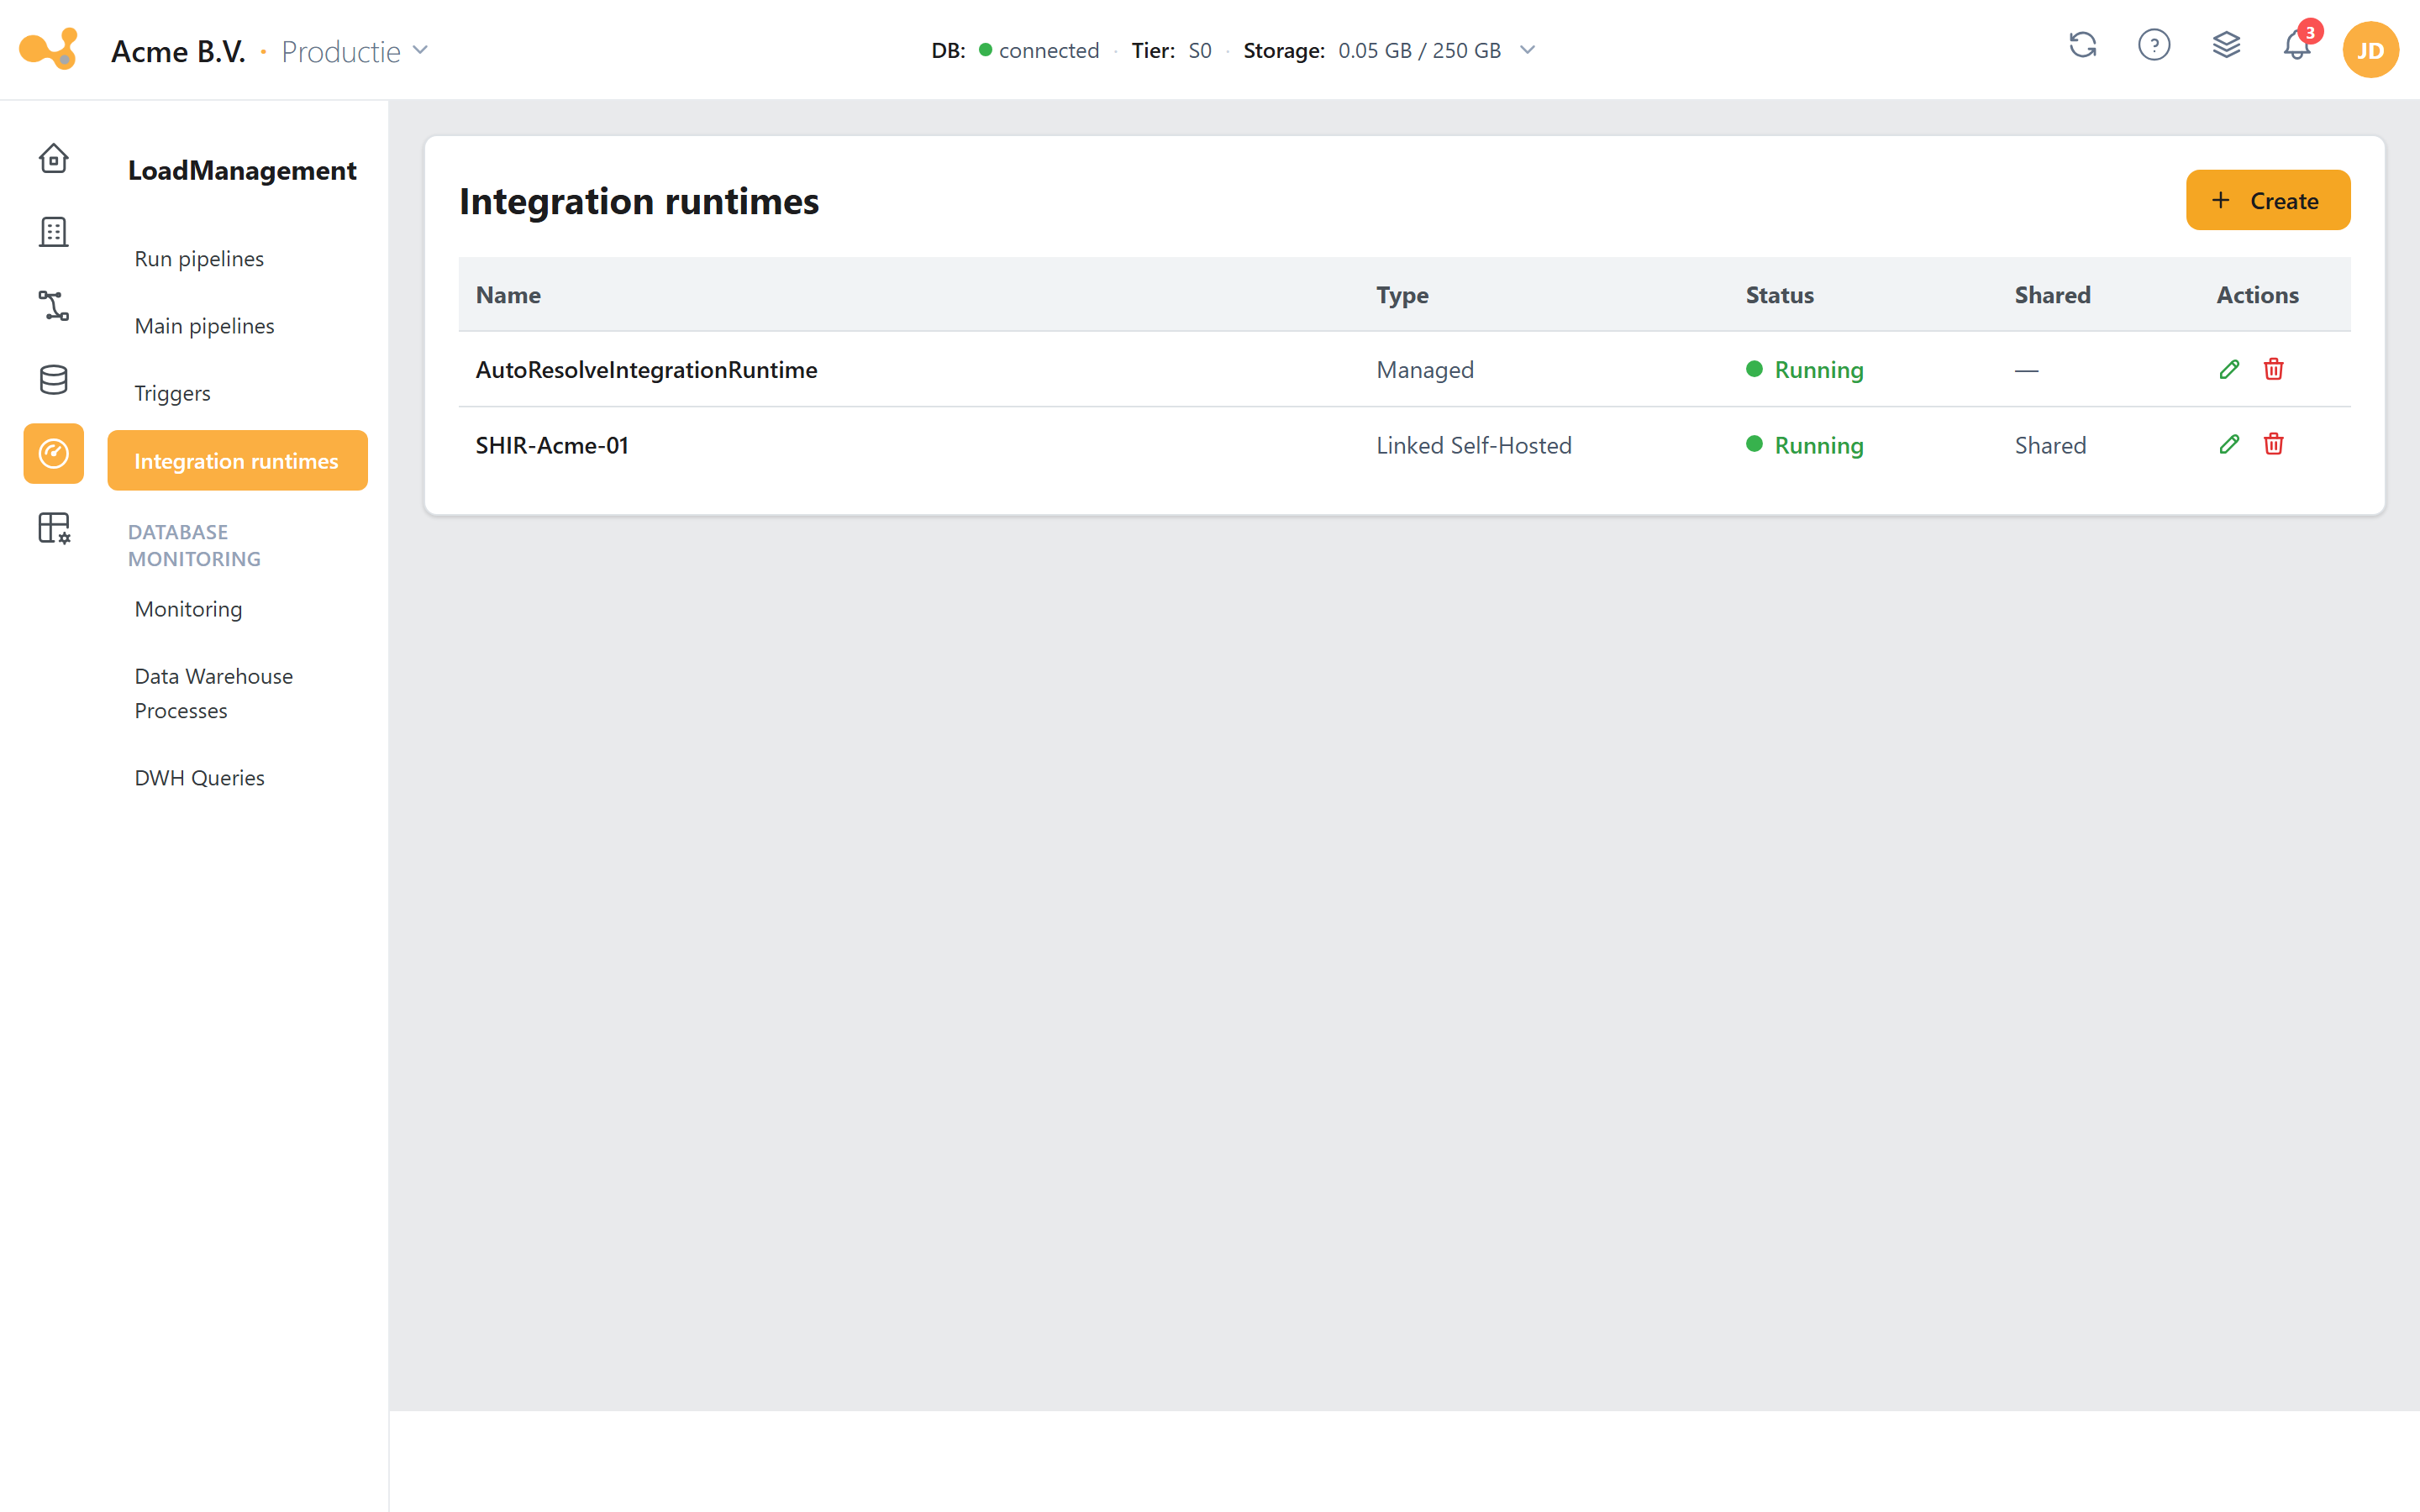
The Integration runtimes screen: the list of integration runtimes (Managed AutoResolve and linked Self-Hosted/shared) with their type and running status, and a Create action.
Monitoring
Route: /loadmanagement/monitoring
Monitor the load status per target table, drill down into the individual runs and steps, and roll back or reset a table. The tree on the left follows source → schema → table; each table shows the last load date and status. The worst status bubbles up (FAILED > RUNNING > SUCCESS) to the schema and source level, so failed loads are visible at a glance.
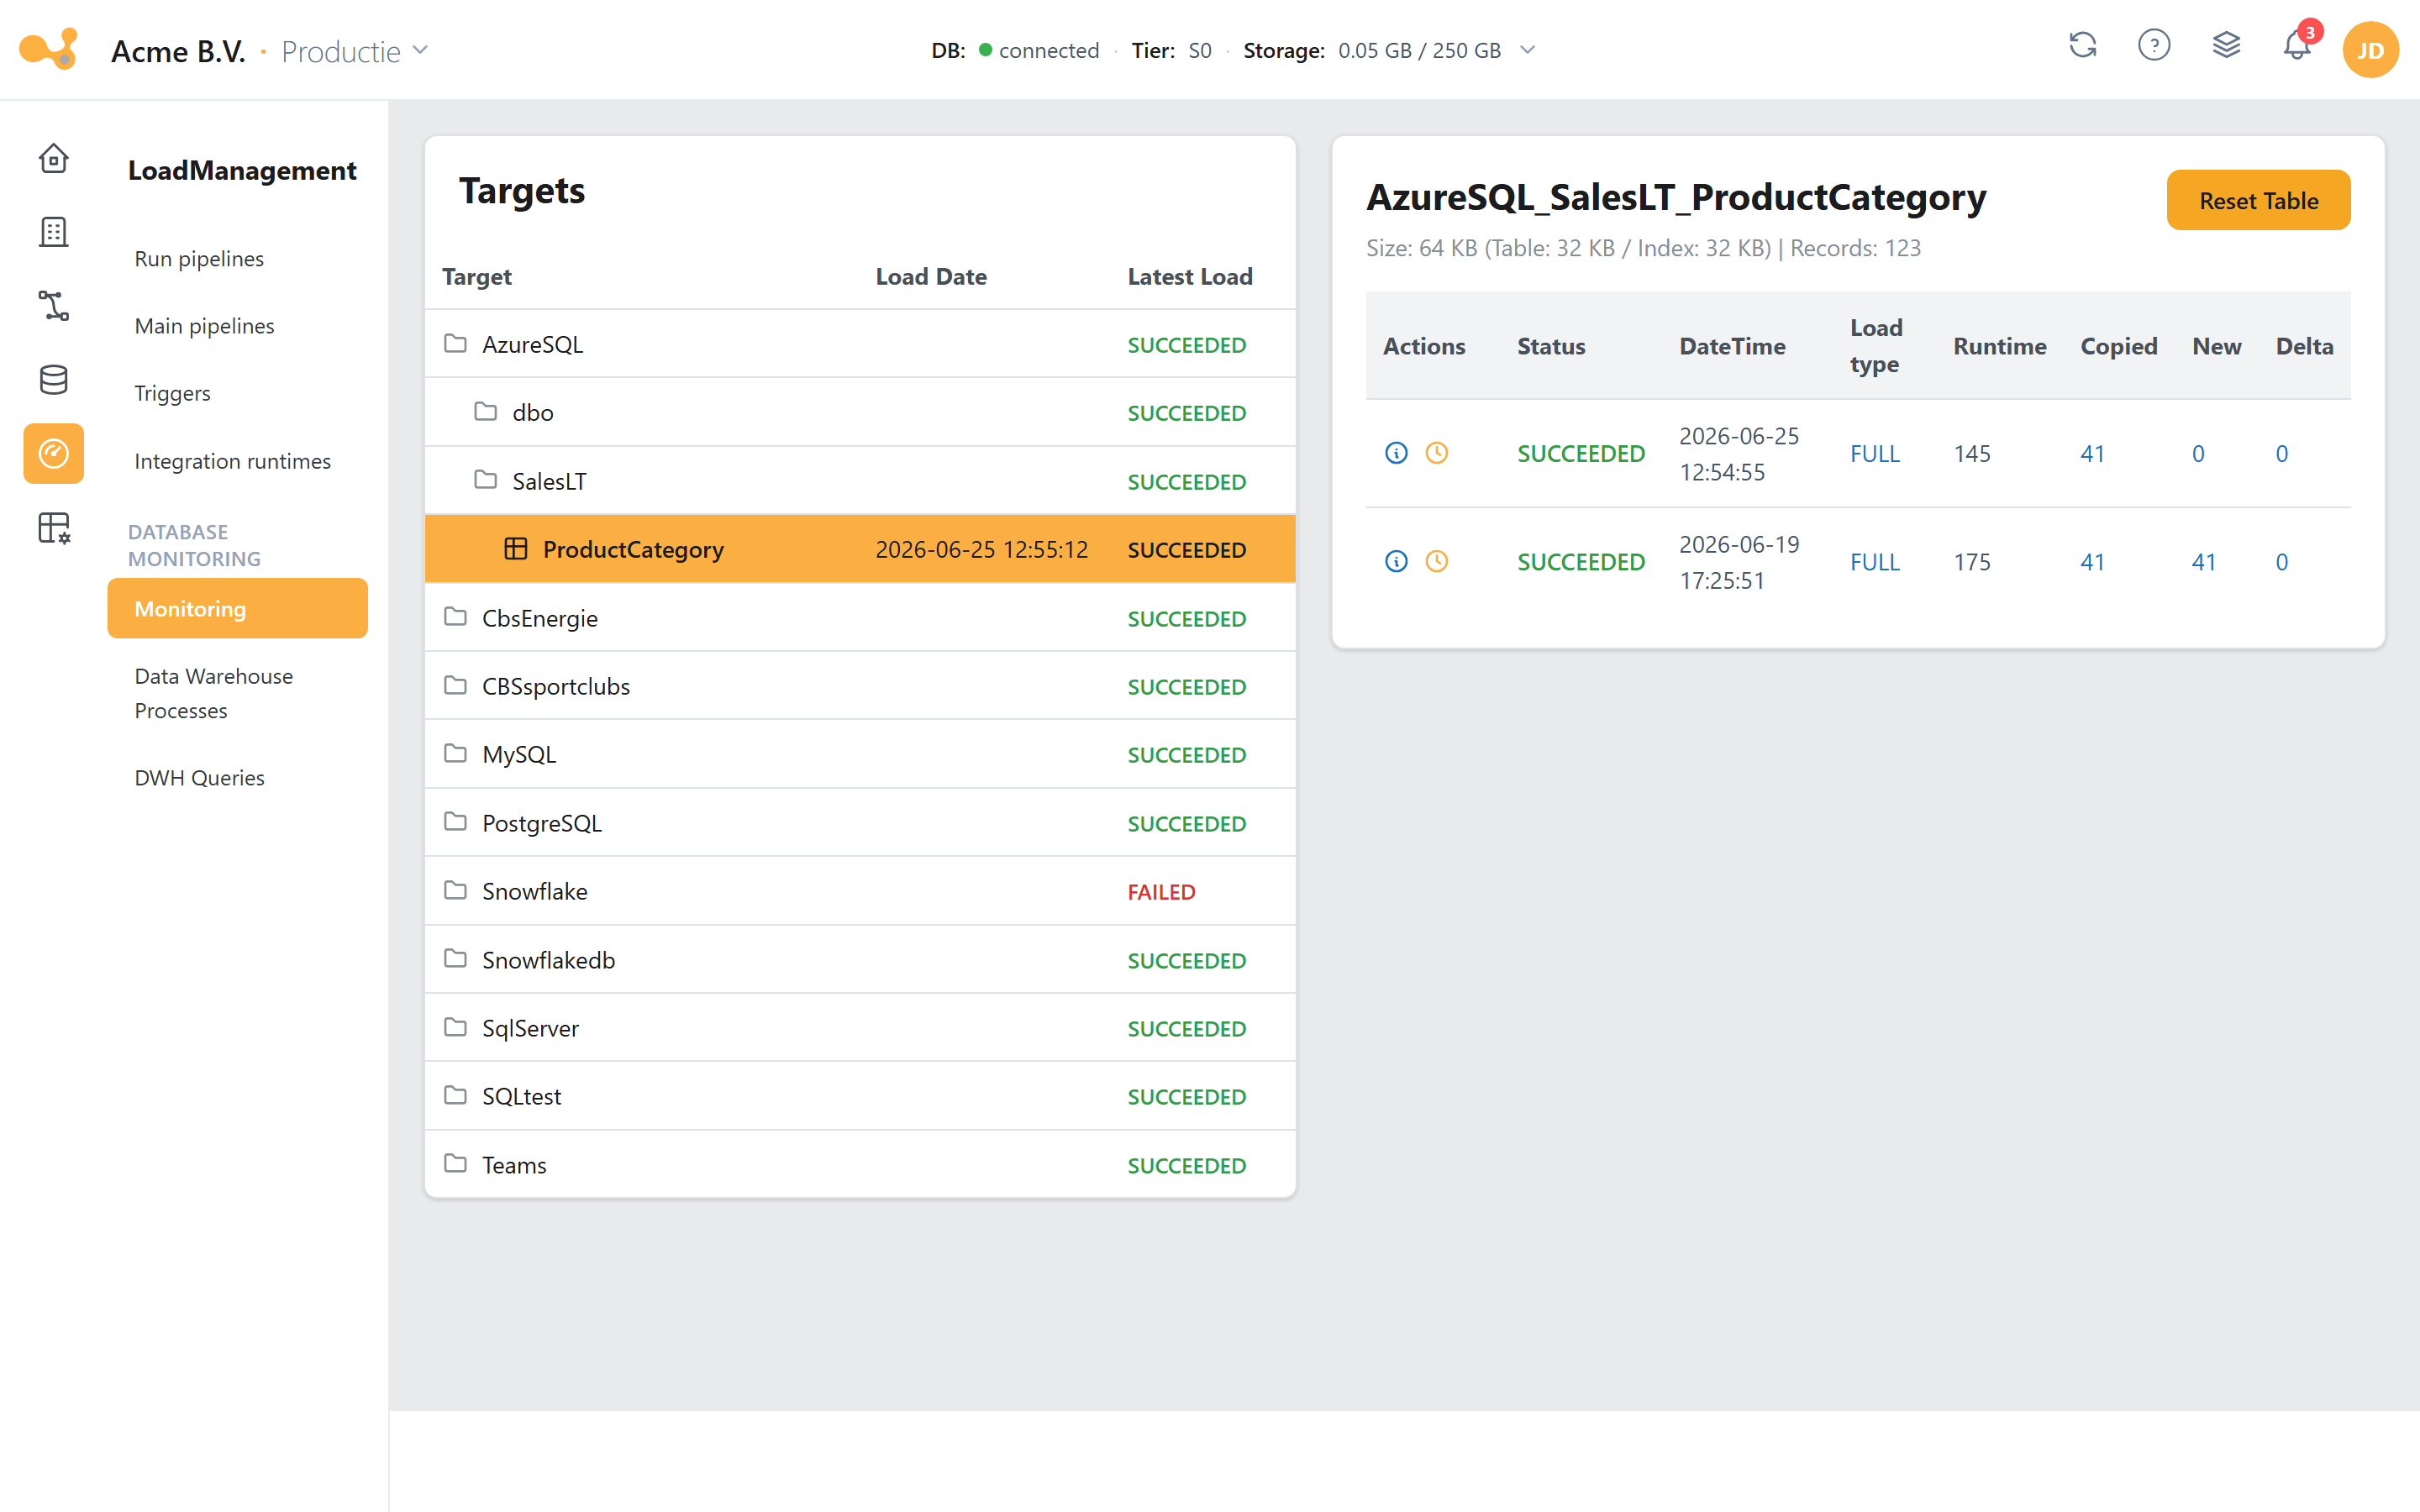
The Monitoring screen: select a target on the left and view its runs and their steps on the right.
(1) Targets tree (Source / Schema / Table) showing, per table, the last load date and a status rollup; the tooltip shows "Failed: x | Running: y | Succeeded: z".
(2) Target header with the selected table plus a Size / Records line (from version 1.53).
(3) Reset table — clears the table after a confirmation.
(4) Runs grid with Status, DateTime, Load type, Runtime, Copied, New, Delta.
(5) Per-run actions — the info icon opens the steps modal (red on FAILED) plus an ADF link; the clock icon opens the rollback form.
(6) Steps modal with Step, DateTime, Status, Log, Rows from [Monitoring].[LS_Trans]; on a failed run, the error message and the ADF link are shown above it.
Rolling back or resetting
- Roll back (clock icon on a run): returns the table to the state it was in before that load.
- Reset table: clears the table entirely; confirm in the warning modal.
The raw log lines behind this screen come from the monitoring views vwLoads (timeline per pipeline) and vwMonitor (broader, including view materialization and Power BI refresh), and from the tables [Monitoring].[LS_Pipeline] (1 row per run) and [Monitoring].[LS_Trans] (1 row per step).
DWH processes
Route: /loadmanagement/datawarehouse-processes
A Processes/Locks view of the active table locks in the database (session, host, login, database, schema, table, lock type), so you can spot blocking processes quickly.
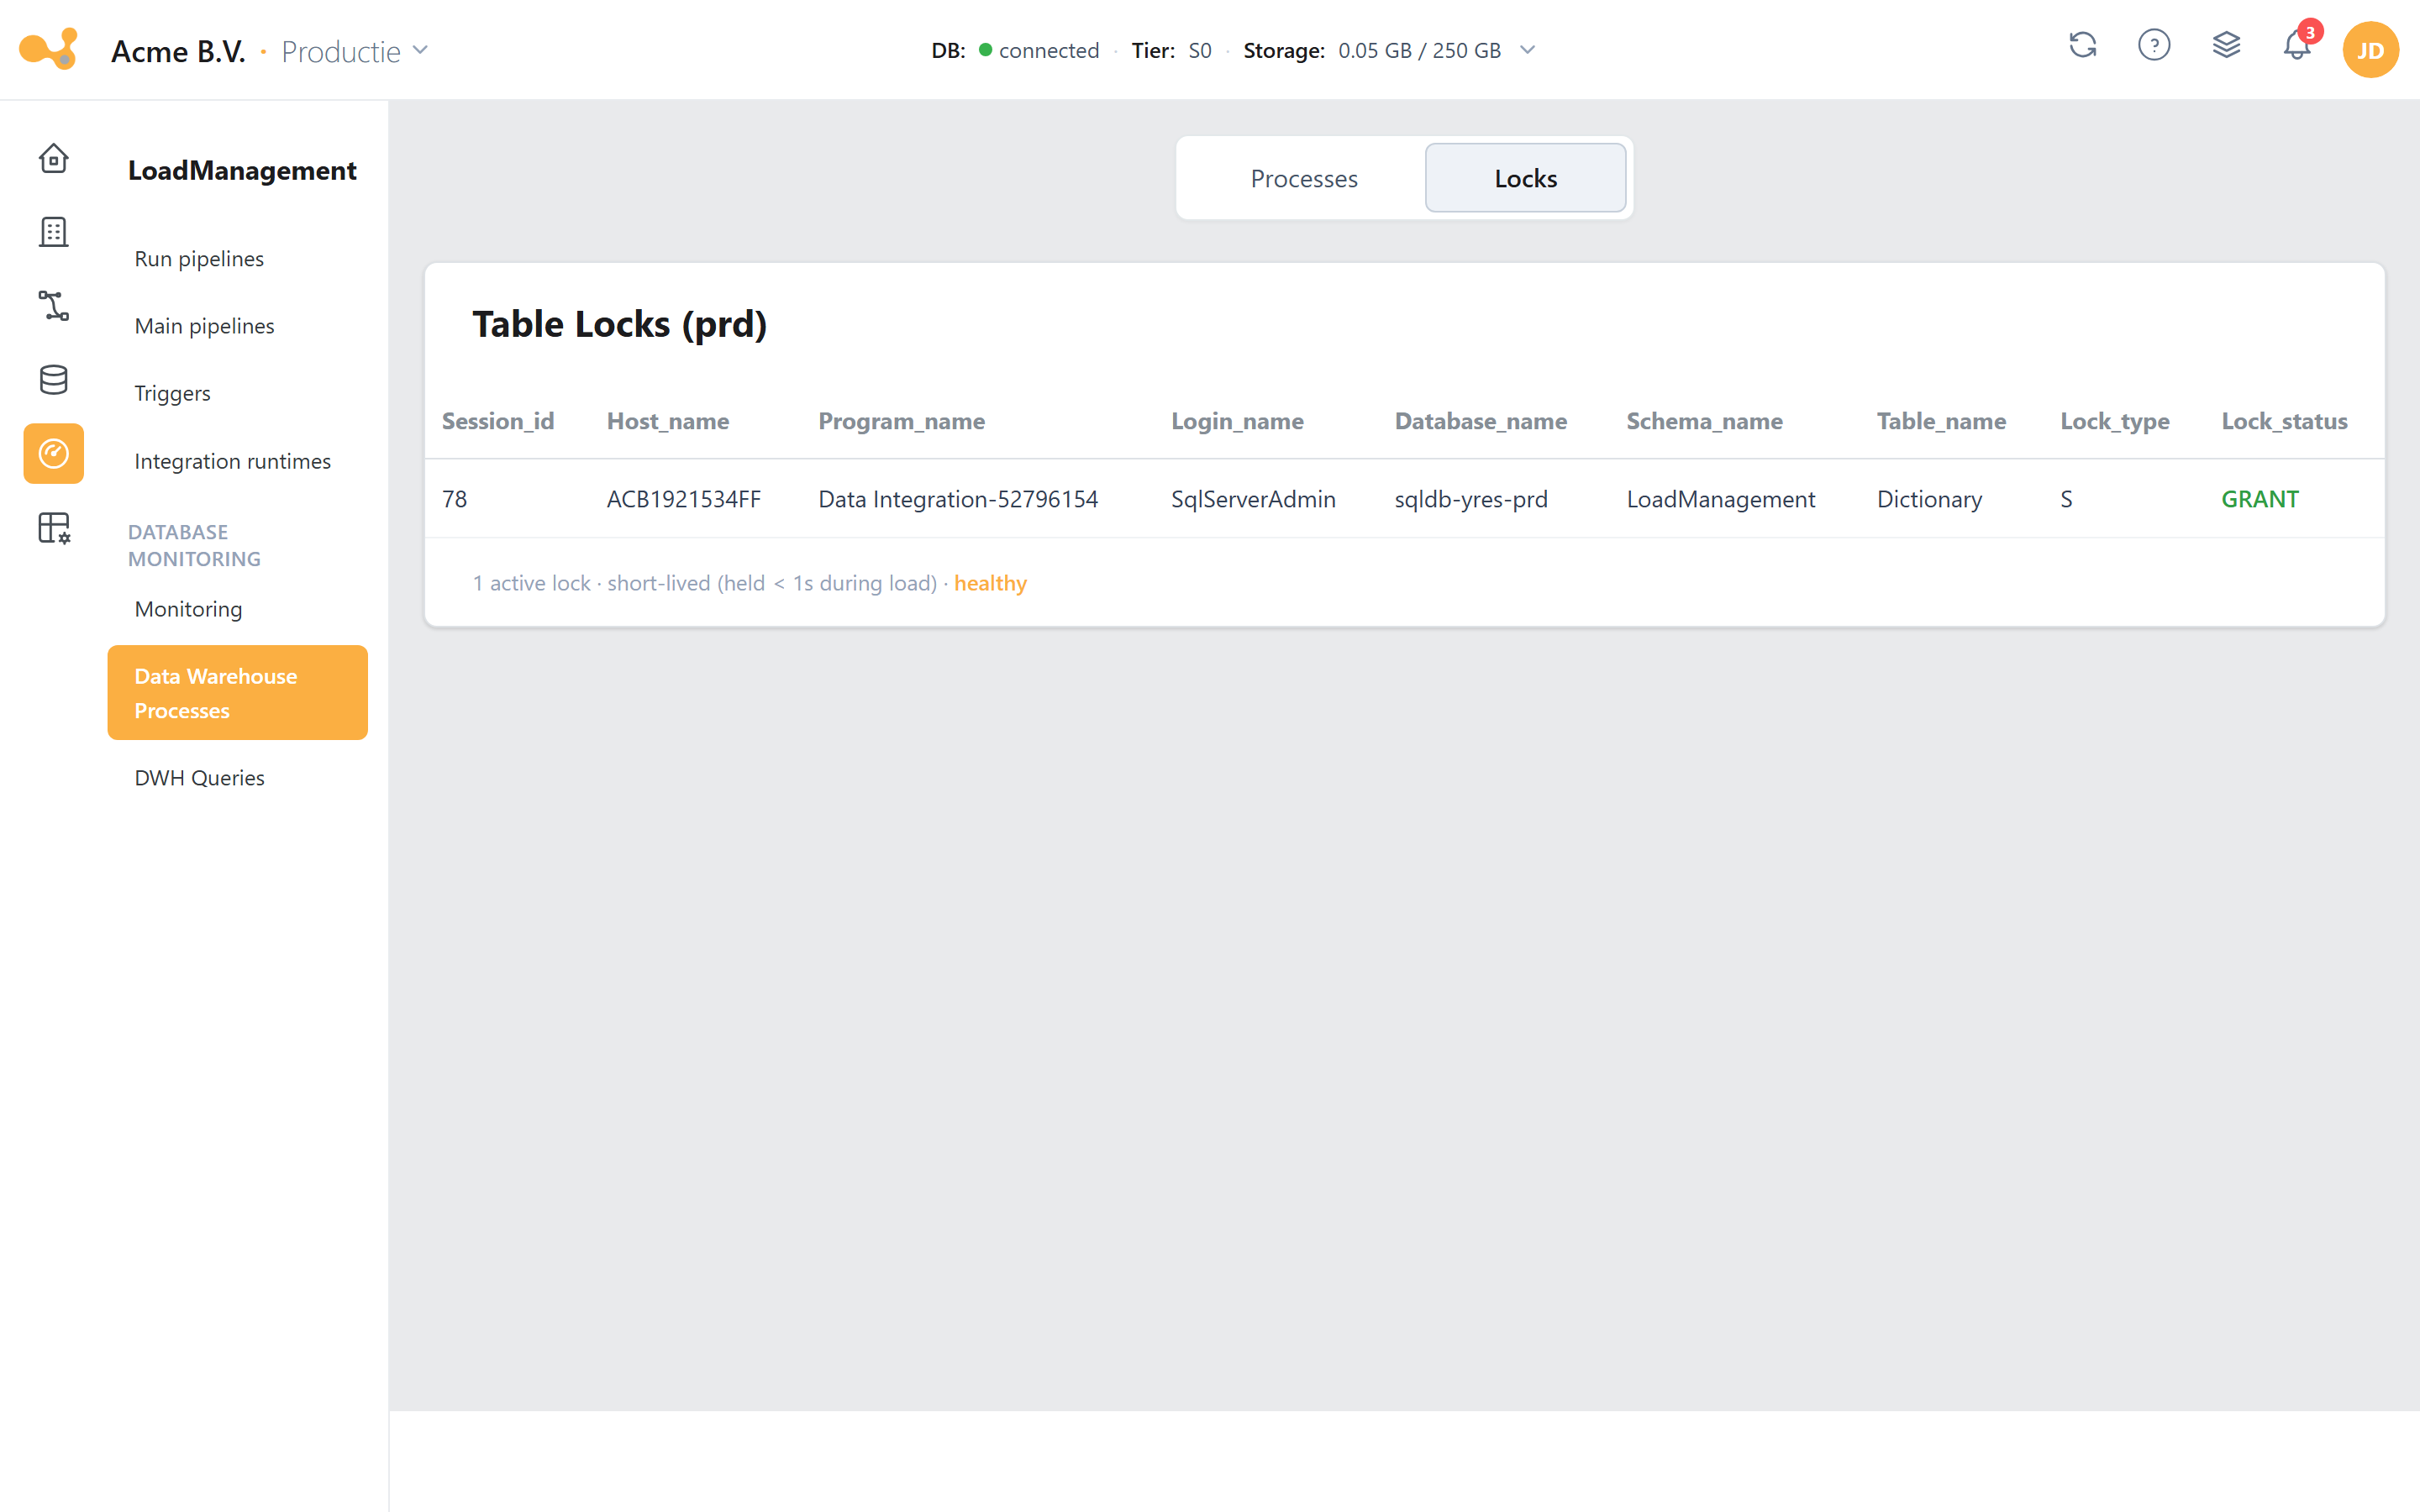
The Data Warehouse Processes screen: review the active table locks to spot blocking.
DWH queries
Route: /loadmanagement/datawarehouse-queries
A list of long running queries (date, query, number of executions, max/avg/total exec seconds) to find slow SQL.
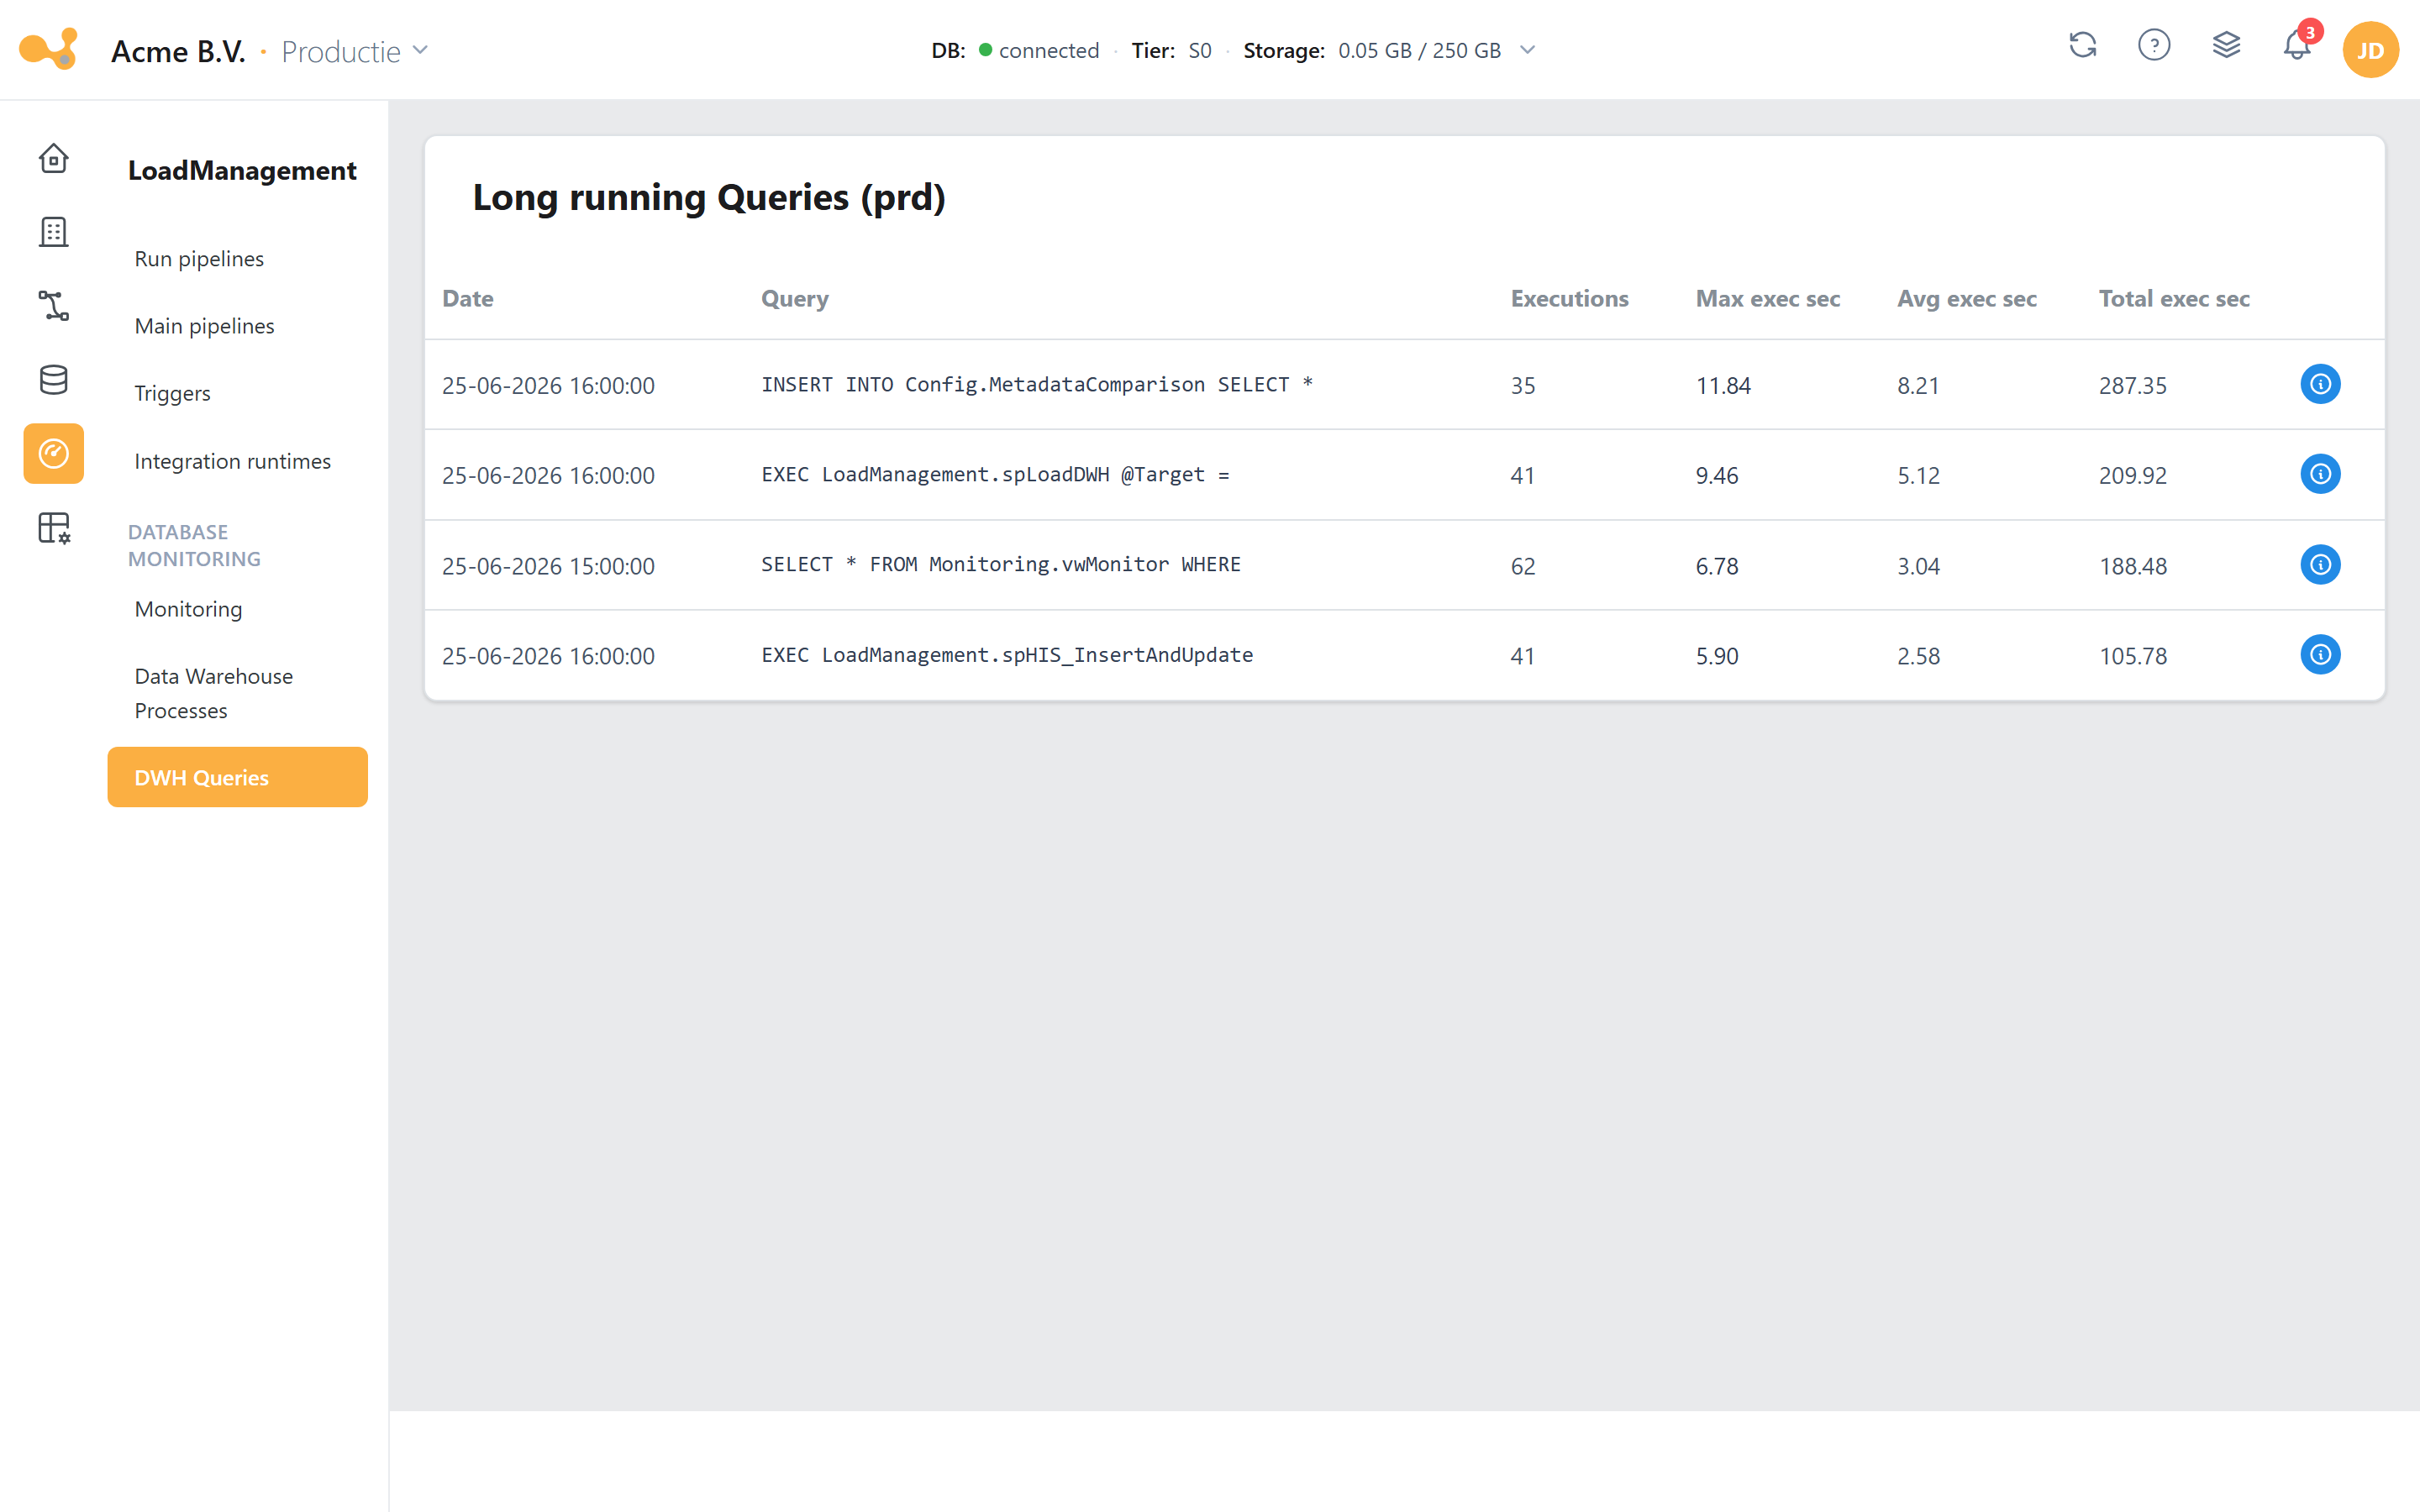
The DWH Queries screen: find slow SQL via the long running queries list.
Master pipelines
Route: /loadmanagement/masterPipelines (a specific flow: /loadmanagement/masterPipelines/:masterPipelineId)
With master pipelines you build your own flow by combining nodes in a visual editor (based on reactflow). You don't draw the underlying ADF activities yourself; you configure nodes and their connections, and Yres generates an ADF pipeline from them (in the Data Factory folder MasterPipelines).
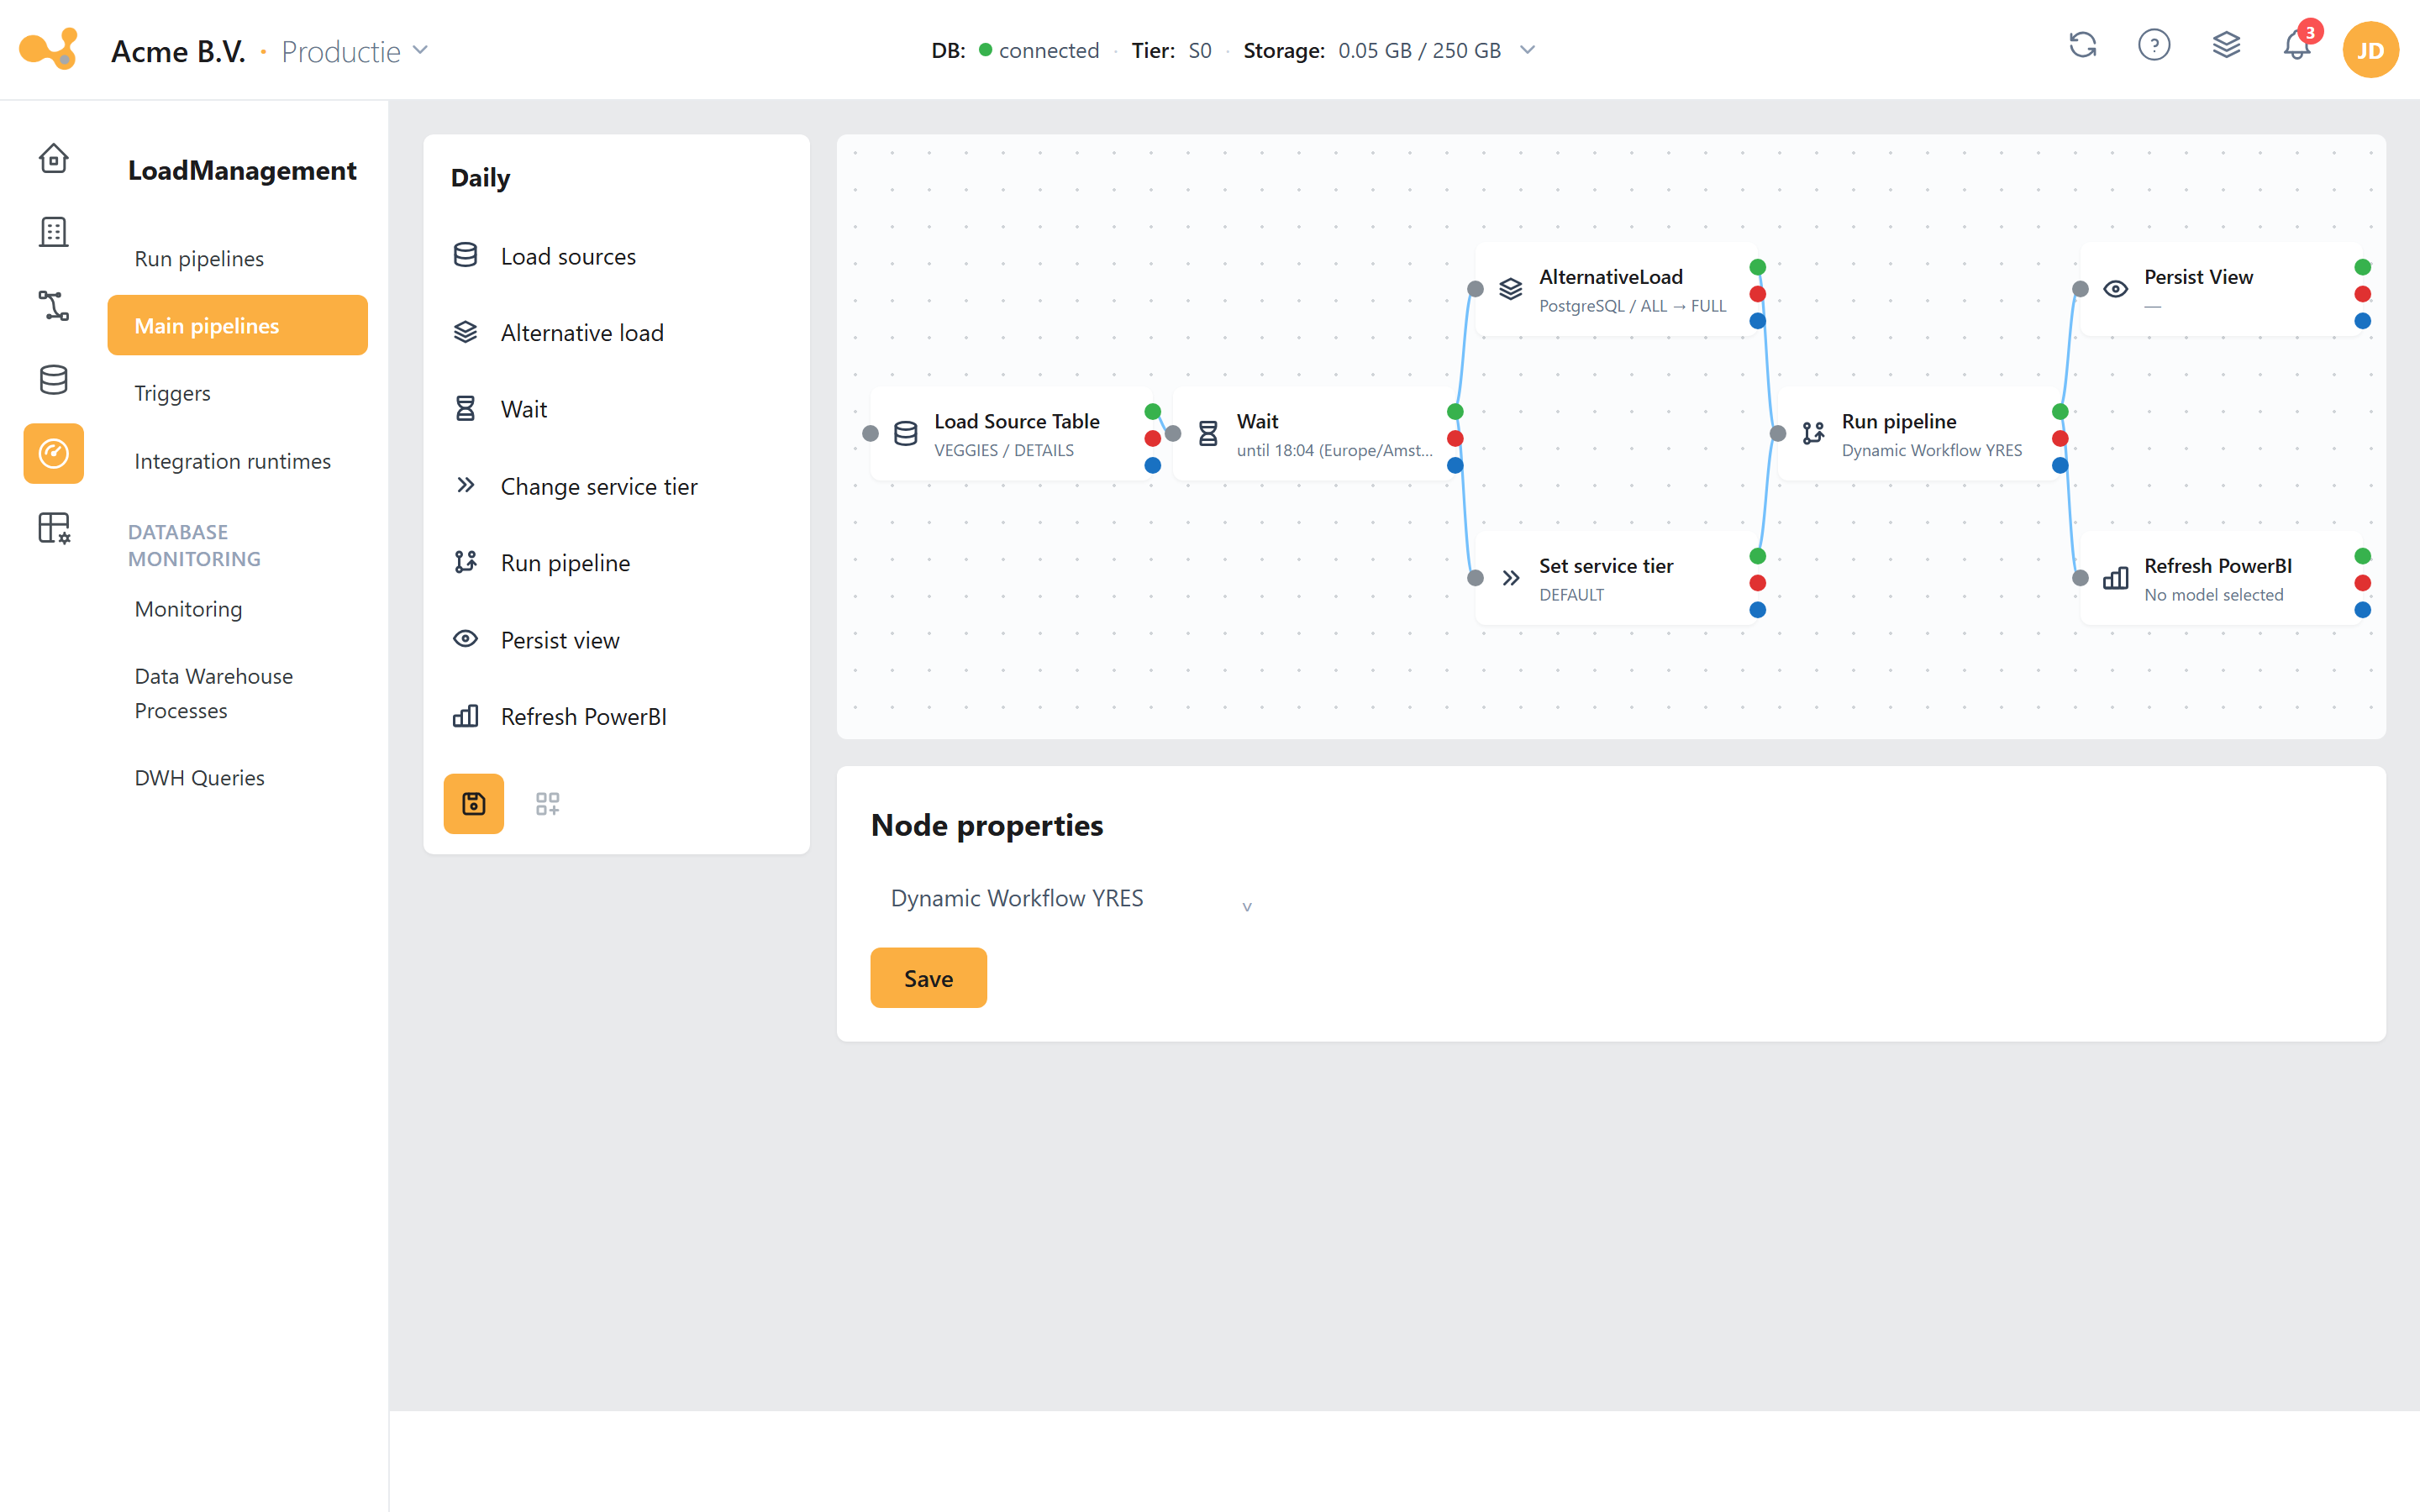
The Design master pipeline screen: drag node types onto the canvas, connect their outputs and publish the flow to ADF.
(1) Node palette on the left — drag a node type onto the canvas. (2) Canvas (reactflow) — connect nodes by dragging from a point on the right of a node to the point on the left of another node; select a node to configure it; delete with Backspace. (3) Three outputs on the right of each node: On success (green), On failure (red) and On completion (blue). This is how you build logic-driven flows (for example: on failure, wait first; otherwise continue). (4) Input on the left of a node — this is where connections arrive. (5) Color legend for the three outputs. (6) Save stores the flow as a draft; Publish (only enabled after a Save) converts the flow into an ADF pipeline. The published pipeline becomes visible in the Data Factory after a few minutes.
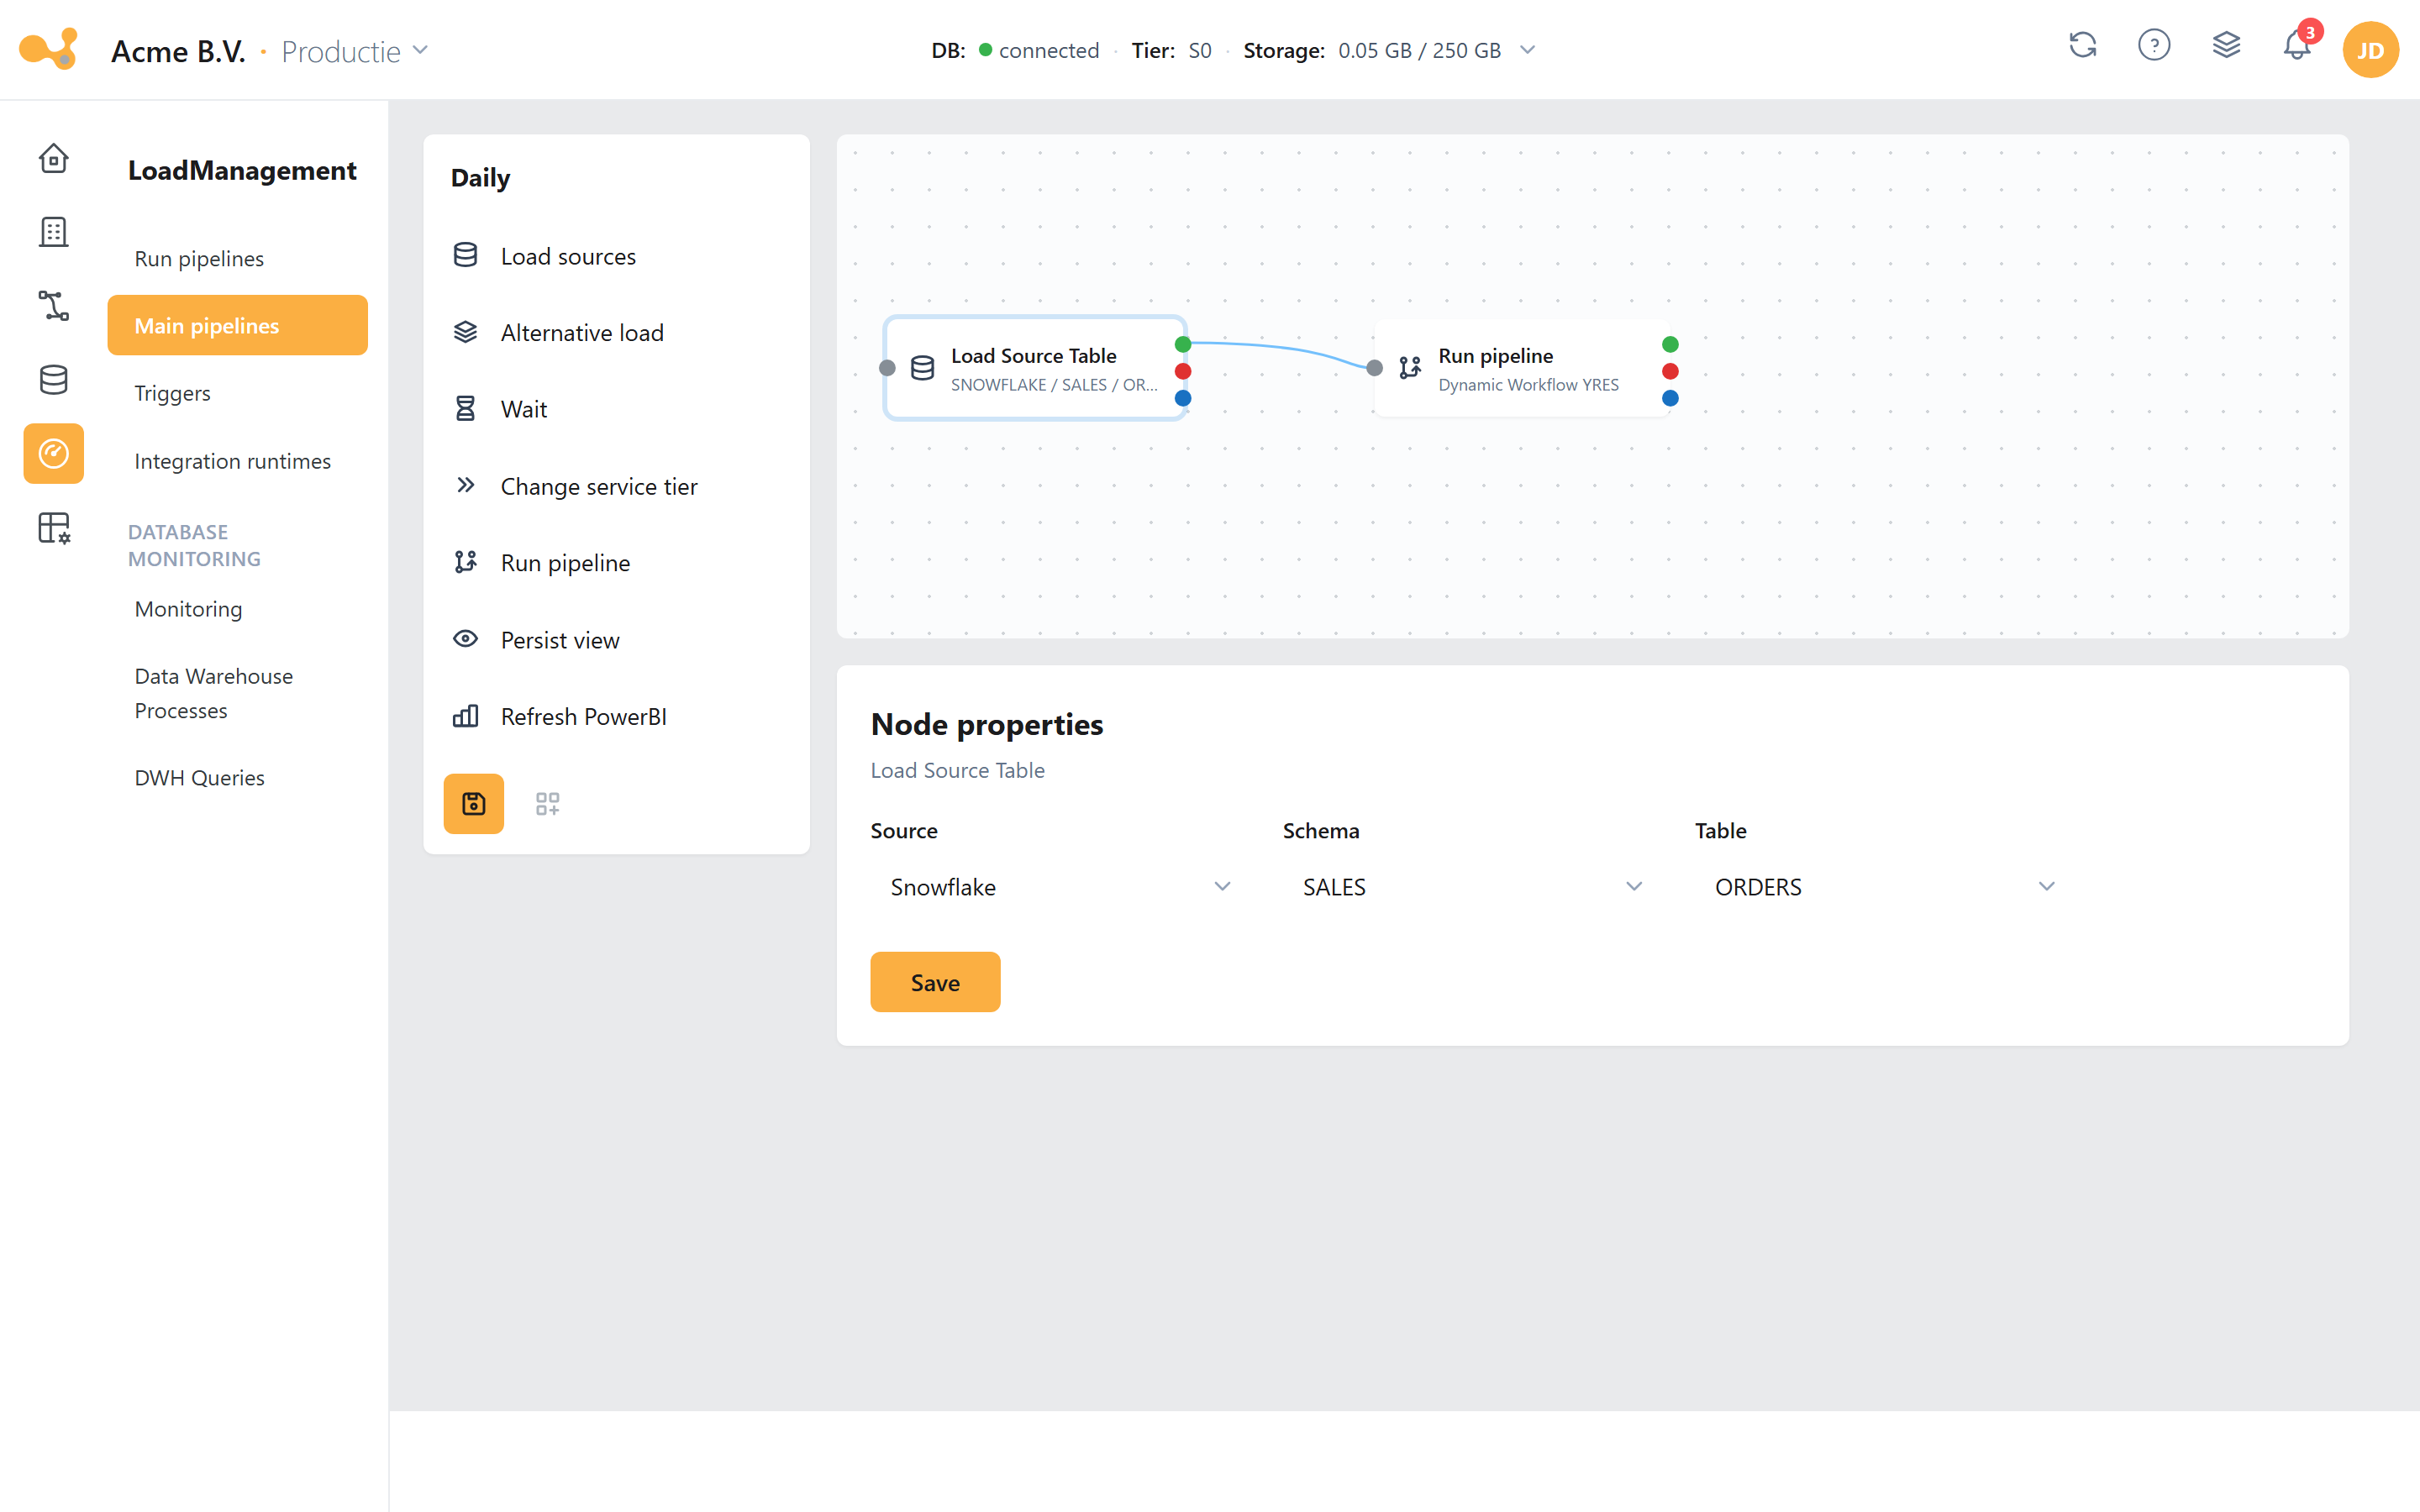 Configuring a node: select a node on the canvas and set its properties on the right (here the source, schema and table for a Load Source Table node).
Node types
| Node | Purpose | Notes |
|---|---|---|
| Load sources | Runs the Dynamic Workflow YRES pipeline for a table. | Requires source, schema and table. |
| Alternative load | Like Load sources, but with an adjustable load type. | Only FULL, IMAGE, OVERWRITE, RELOAD (this is the UI option set for an ad-hoc override, not the full engine set). |
| Wait | Waits until a specific time. | Takes the timezone from your user settings into account. |
| Change service tier | Changes the Azure SQL service tier for the duration of the pipeline. | Below Standard_S3 there is no Columnstore index; below P1 there are no in-memory tables. |
| Run pipeline | Runs another Yres, custom or master pipeline. | — |
| Refresh PowerBI | Refreshes a Power BI model configured in Yres. | See Admin → PowerBI Models. |
| Persist view | Runs the Materialize View pipeline. | Requires source, schema and table. |
The list of node types may be expanded in the future.
A master pipeline lets you wire existing Yres building blocks (loads, waits, tier switches, view materialization, Power BI refresh) together with success/failure/completion logic. It is not a free-form ADF pipeline designer: you don't design individual copy activities or data transformations. Yres generates the underlying ADF pipeline based on your nodes.
Screens & routes
| Screen | Route |
|---|---|
| Run pipelines | /loadmanagement/runPipelines |
| Design master pipeline | /loadmanagement/masterPipelines |
| Triggers | /loadmanagement/triggers |
| Integration runtimes | /loadmanagement/integration-runtimes |
| Monitoring | /loadmanagement/monitoring |
| DWH processes | /loadmanagement/datawarehouse-processes |
| DWH queries | /loadmanagement/datawarehouse-queries |
| Scripted objects | /loadmanagement/scriptedObjects |
These are the live, subdomain-bound paths from the running app. Older id-in-path routes (such as
/loadmanagement/azuredatafactory) are legacy and no longer in use.