Monitoring & logging
Every load run in Yres leaves a trail. The data-plane database (IRIS_DWH) writes at three levels — per workflow, per pipeline run and per micro-step — plus a continuous proc log and a DDL/permission audit. This chapter explains which procedure writes, into which tables, and which views let you read it back in the webapp or via a SQL endpoint (SSMS, Azure Data Studio).
The logging is easiest to understand alongside the data flow (vwExtractor → STAGE → spLoadDWH → spHIS_InsertAndUpdate → HIS → spWriteLoadStatus). Every step in that chain writes a log line.
In short
| Level | Written by | Table | Granularity |
|---|---|---|---|
| Pipeline run | [Monitoring].[spWriteLoadStatus] | [Monitoring].[LS_Pipeline] | 1 row per run (at Start workflow / Start load) |
| Micro-step | [Monitoring].[spWriteLoadStatus] | [Monitoring].[LS_Trans] | 1 row per step (always) |
| Table load (status) | [LoadManagement].[spPrepareWorkload] (PLANNED/SKIPPED) → [Monitoring].[spWriteLoadStatus] (RUNNING/SUCCEEDED/FAILED) | [LoadManagement].[LoadLog] | durable status per table load |
| Proc/app log | [Config].[spWriteMessage] / Warning / Error / Log | [Config].[ProcessLog] | messages and errors per stored procedure |
| DDL/permission audit | database triggers | [Config].[EventLog] | object and permission changes |
You read it back through the monitoring views — chiefly vwLoads (the per-pipeline load timeline) and vwMonitor (broader: also materialized views and Power BI refreshes).
vwLoadMonitor does not existThere is no view [Monitoring].[vwLoadMonitor]. Use vwLoads (pipeline timeline) or vwMonitor (broader) instead.
Before the start: PLANNED and SKIPPED
spWriteLoadStatus (below) only sets a table load to RUNNING once ADF actually picks it up. Before that point, the LoadLog row passes through two statuses that are not set by spWriteLoadStatus but by [LoadManagement].[spPrepareWorkload] — in the "Get tables" Lookup step of Dynamic Workflow YRES, before vwExtractor/fxExtractor returns the work list (see data flow, step 3):
PLANNED— there is (not yet) anotherPLANNEDorRUNNINGrow for the sameSource/SourceSchema/SourceTable. This row is actually picked up: at the end,spPrepareWorkloaddynamically builds aSELECTthat only returnsLoadLogrows withLoadStatus = 'PLANNED'for thisWorkFlowto theForEachloop.SKIPPED—spPrepareWorkloadfound (viafxExtractor, which joinsvwLatestLoadrestricted toLoadStatus IN ('PLANNED','RUNNING')) that a not-yet-finished load for that exact table already existed. ALoadLogrow is still written — for traceability, "this request came in" — but immediately with statusSKIPPED, and that row does not come back in theForEachloop.
This is the non-concurrency lock: without this check, a second trigger (or an overlapping manual run) would queue the same table again while the previous load was still in progress. [LoadManagement].[vwLatestLoad] explicitly excludes SKIPPED rows when determining "the latest load" per table, so a skipped duplicate never hides the real (still running or already finished) load in the monitoring screens or in vwMonitor.
SKIPPED is not an errorA SKIPPED row does not mean something went wrong — it means the same table was already queued or loading elsewhere when this request came in (for example, two overlapping triggers). The Monitoring page does not treat such a row as a failure.
The central logger: spWriteLoadStatus
[Monitoring].[spWriteLoadStatus] is the heart of the monitoring. The ADF workflow calls it at fixed points — at Start workflow, per table at Start load and End load, and at End Workflow — and it does three things at once:
LS_Pipeline— at@Step IN ('Start workflow','Start load'), one row per run is written.LS_Trans— on every call, one row is written (the high-volume step timeline).LoadLog— the durable status per table load is transitioned: at Start toRUNNING, at@Status IN ('Success','Succeeded')toSUCCEEDED, and at@Status IN ('Failed','Fail','Error')toFAILED(with@Logappended toLoadLog.Error).
Parameters
The procedure has 16 parameters (all but @PipelineID optional):
| Parameter | Type | Role |
|---|---|---|
@PipelineID | NVARCHAR(255) | Run identifier. 'UNKNOWN' → resolved from LS_Pipeline (last 24 h, by Target + LoadType). |
@Process | NVARCHAR(255) | E.g. Workflow or load. |
@Step | NVARCHAR(255) | Step name (determines whether LS_Pipeline is written). |
@Status | NVARCHAR(255) | Determines the LoadLog status and whether an error is raised. |
@Rows | BIGINT | Number of rows processed for this step. |
@WorkflowID | NVARCHAR(255) | Workflow identifier. NULL → derived from recent runs. |
@PipelineName | NVARCHAR(255) | Name of the ADF pipeline. |
@Started_by | NVARCHAR(255) | Who/what started the run (trigger, user, webapp). |
@Target | NVARCHAR(255) | Target (concatenated target name). |
@Source_system | NVARCHAR(255) | Source system. |
@Table | NVARCHAR(255) | Source table. |
@Schema | NVARCHAR(255) | Source schema. |
@LoadType | NVARCHAR(255) | Load type of this run (FULL, DELTA, …). |
@LatestRecord | NVARCHAR(255) | Highest delta value of this run (the watermark for DELTA-like load types). |
@ETL_Date | DATETIME | Load timestamp. |
@Log | NVARCHAR(MAX) | Free log text; defaults to 'No details provided'. On errors, the error message. |
@LatestRecord, not "LapageRecord"In older wiki extractions this parameter appeared as @LapageRecord. That is an OCR error: the parameter is named @LatestRecord. The same applies to the columns LatestRecord, LatestRuntime and [LatestLoad] in the views and log tables.
Robustness
spWriteLoadStatus is hardened so that monitoring never breaks a load run:
- All bookkeeping writes sit inside a
TRY/CATCHand are best-effort — a failed log line must not stop the calling load. On an internal failure the procedure writes a guarded breadcrumb under the step'spWriteLoadStatus logging error'. - The deliberate
RAISERRORfor@Status IN ('Failed','Fail','Error')sits outside theTRY, so that real load failures always propagate to ADF (and thus become visible in the pipeline run).
The log tables
The views below are derived from five raw tables. You can also query them directly via a SQL endpoint, but for day-to-day use the views (and the webapp) are more convenient.
[Monitoring].[LS_Pipeline] — one row per run
Columns: WorkflowID, PipelineID, PipelineName, Process, Source_system, Target, DateTime DATETIME2, Started_by, Schema, Table, LoadType, CopiedRows BIGINT, LatestRecord DATETIME2, ETLDate DATETIME2.
[Monitoring].[LS_Trans] — one row per micro-step
Columns: PipelineID, Rows BIGINT, Step, DateTime DATETIME2, Status, Process, log NVARCHAR(MAX). This is the high-volume timeline that the pivot views (vwLoads, vwMonitor, vwWorkflow) condense into per-step runtimes.
[LoadManagement].[LoadLog] — durable status per table load
RowId IDENTITY, Source, SourceSchema, SourceTable, TargetTable, SourceType, TriggerName, LoadType, Script, LoadName, WorkFlow, Pipeline, PlannedAt, StartedAt, FinishedAt, LoadStatus, Error, …. This is the status backbone: spWriteLoadStatus moves it from RUNNING → SUCCEEDED/FAILED here, and vwMonitor joins onto it.
[Config].[ProcessLog] — proc/app log
The full message log per stored procedure: processID, logID, timestamp, callSource, appUser, spName, spStep, returnCode, message1-4, dbUser, dbServer, dbName, dbRequest, and on errors errorLine, errorMessage, errorNumber, errorPrecedure, errorSeverity, errorState.
errorPrecedure is not a typo in this wikiThe column is literally named errorPrecedure (without the second o) — that is how it appears in both ProcessLog and the procedure spWriteError. We reproduce the name unchanged on purpose.
The four writers ([Config].[spWriteMessage], spWriteWarning, spWriteError, spWriteLog) share the same 10-parameter block and all write to ProcessLog. An INSTEAD OF DELETE,UPDATE trigger blocks changing/deleting rows unless the AllowSettingsUpdates setting is on.
[Config].[EventLog] — DDL/permission audit
Object and permission changes: EventType, ObjectType, TimeStamp, ServerName, DatabaseName, SchemaName, ObjectName, script, fullCommand XML, ChangedBy, …. This is the source of vwAccessManagement, vwUserManagement and vwObjectAlterations.
Retention of the log tables
The retention policy below is part of v1.56 (in test). Older versions have no cleanup mechanism: the log tables grow without bound there.
The log tables grow with every run (LS_Trans writes ~12 rows per merge page; LoadLog one row per table per workflow run). Without cleanup, everything that touches monitoring — the planning view vwExtractor, vwMonitor, the monitoring screens — gets slower over time. That is why there is a configurable per-table retention policy:
[Monitoring].[RetentionPolicy]— one row per log table withRetentionDays(minimum 7) and anActiveswitch. Defaults are seeded at deploy time (only when the row does not exist yet, so your own changes survive):LS_TransandProcessLog90 days,LS_PipelineandAdfLoadMonitor180 days,LoadLogandDeletedLoads365 days.[Maintenance].[spApplyRetentionPolicy]— the cleanup procedure. Deletes everything older than the retention period in batches, while guarding monitoring integrity: the latest run per table load (whichvwLatestLoadandvwExtractorrely on), allPLANNED/RUNNINGloads and the detail rows of those protected runs are ALWAYS preserved, regardless of the configured days. Only tables with an explicit cleanup rule are touched.- ADF pipeline
Maintenance Retention YRES— runs the procedure on a schedule via theRetentiontrigger (weekly, Sunday 03:00). The trigger ships stopped and must be enabled per environment. The pipeline parameterDryRun = truegives a simulation: per table, the number of rows that would be deleted, without deleting anything.
Every run logs its summary (per table: deleted rows + note) to LS_Trans with Process = 'Maintenance'.
The monitoring views
| View | Level | Use |
|---|---|---|
[Monitoring].[vwLoads] | per pipeline run | The canonical load timeline. A pivot of LS_Trans over the steps (Start load → upsert HIS → End load), with per-step runtime, row counts (Copied/Delta/New/Deleted), the [LatestLoad] flag and ADF deep links. |
[Monitoring].[vwMonitor] | broader | Runs on LoadLog and adds two extra sources via UNION: materialized views (Materialize Views) and Power BI refreshes (Refresh_PBI). Basis for fxGetTableLoads and vwUsedTables. |
[Monitoring].[vwWorkflow] | per workflow | A pivot of LS_Trans (Process = Workflow) over the workflow steps, joined with LS_Pipeline. |
[Monitoring].[vwUsedTables] | per table | The latest load + status per used table (LatestLoad = the [ETL Date], LatestStatus = the status). |
[Monitoring].[vwAccessManagement] | audit | One row per Grantee × Permission from EventLog (GRANT/DENY/REVOKE). |
[Monitoring].[vwUserManagement] | audit | User/role lifecycle events. |
[Monitoring].[vwObjectAlterations] | audit | DDL changes by real users (excluding ADF/Unknown). |
[Config].[vwUserlog] / [Config].[vwUserLogJSON] | proc log | Readable view over ProcessLog (the second as JSON for the webapp). |
vwLoads for the question "how did this pipeline run go, step by step?". vwMonitor for the broader overview including view materialization and PBI refreshes. For proc-level messages and errors: vwUserlog (or the DWH logs page in the webapp).
Reviewing in the webapp
Load management → Monitoring
The Monitoring page (/loadmanagement/monitoring) shows the load status per target, the individual runs and — on a failure — the steps. Under the hood it reads vwLoads/vwMonitor and the LS_Trans table.
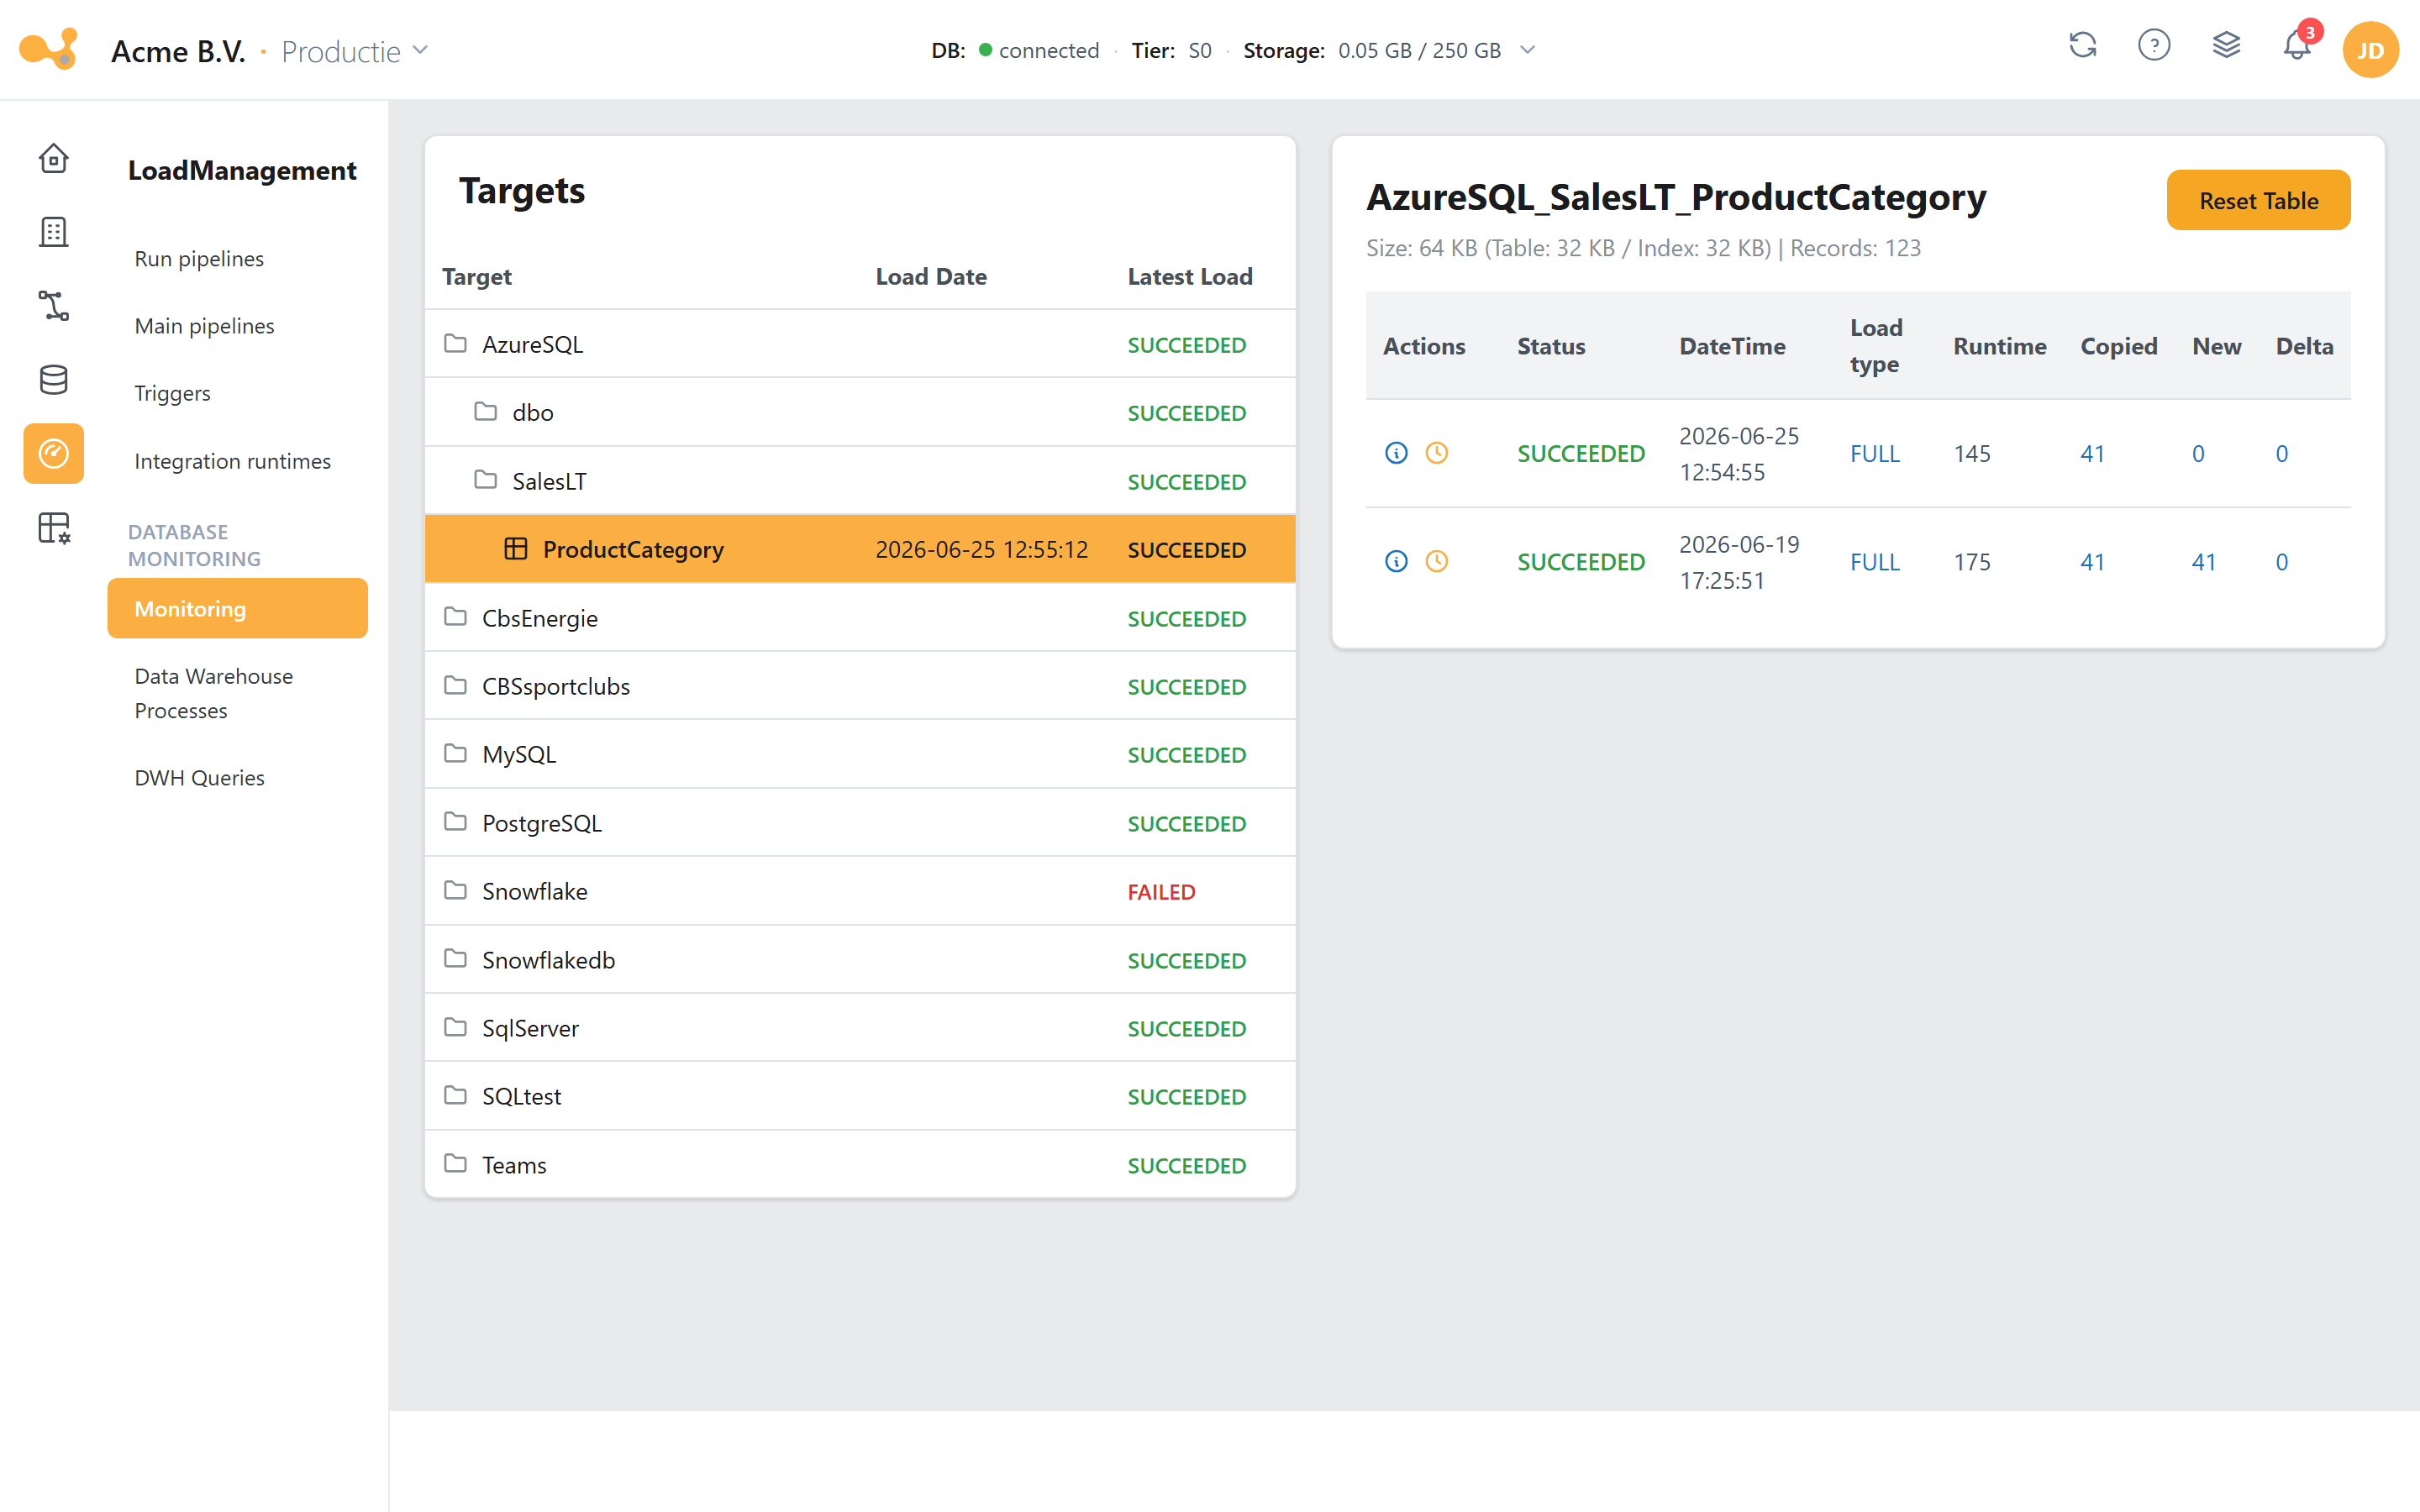
The Monitoring page: pick a target on the left, view the runs on the right, and open the steps per run.
- Targets tree — Source / Schema / Table with, per row, the load date, status (SUCCEEDED / RUNNING / FAILED) and a status roll-up per source.
- Selected target — name plus a summary of size (table + index) and record count.
- Reset table — resets the table (confirmation required). See also rollback & reset.
- Runs grid — per run: Status, DateTime, Load type, Runtime, Copied / New / Delta rows. A failed run shows a red info icon.
- Per-run actions — the info icon opens the steps modal; the clock icon starts a rollback of that run.
- Steps modal — the steps of the run from
[Monitoring].[LS_Trans](Step / DateTime / Status / Log / Rows) with a Link to ADF. On a FAILED run, the error message and the ADF link appear above the grid.
Admin → DWH logs
The DWH logs page (/admin/dwhlogs) shows the step-by-step actions of stored procedures from [Config].[ProcessLog] — handy for seeing which procedure failed and with what message.
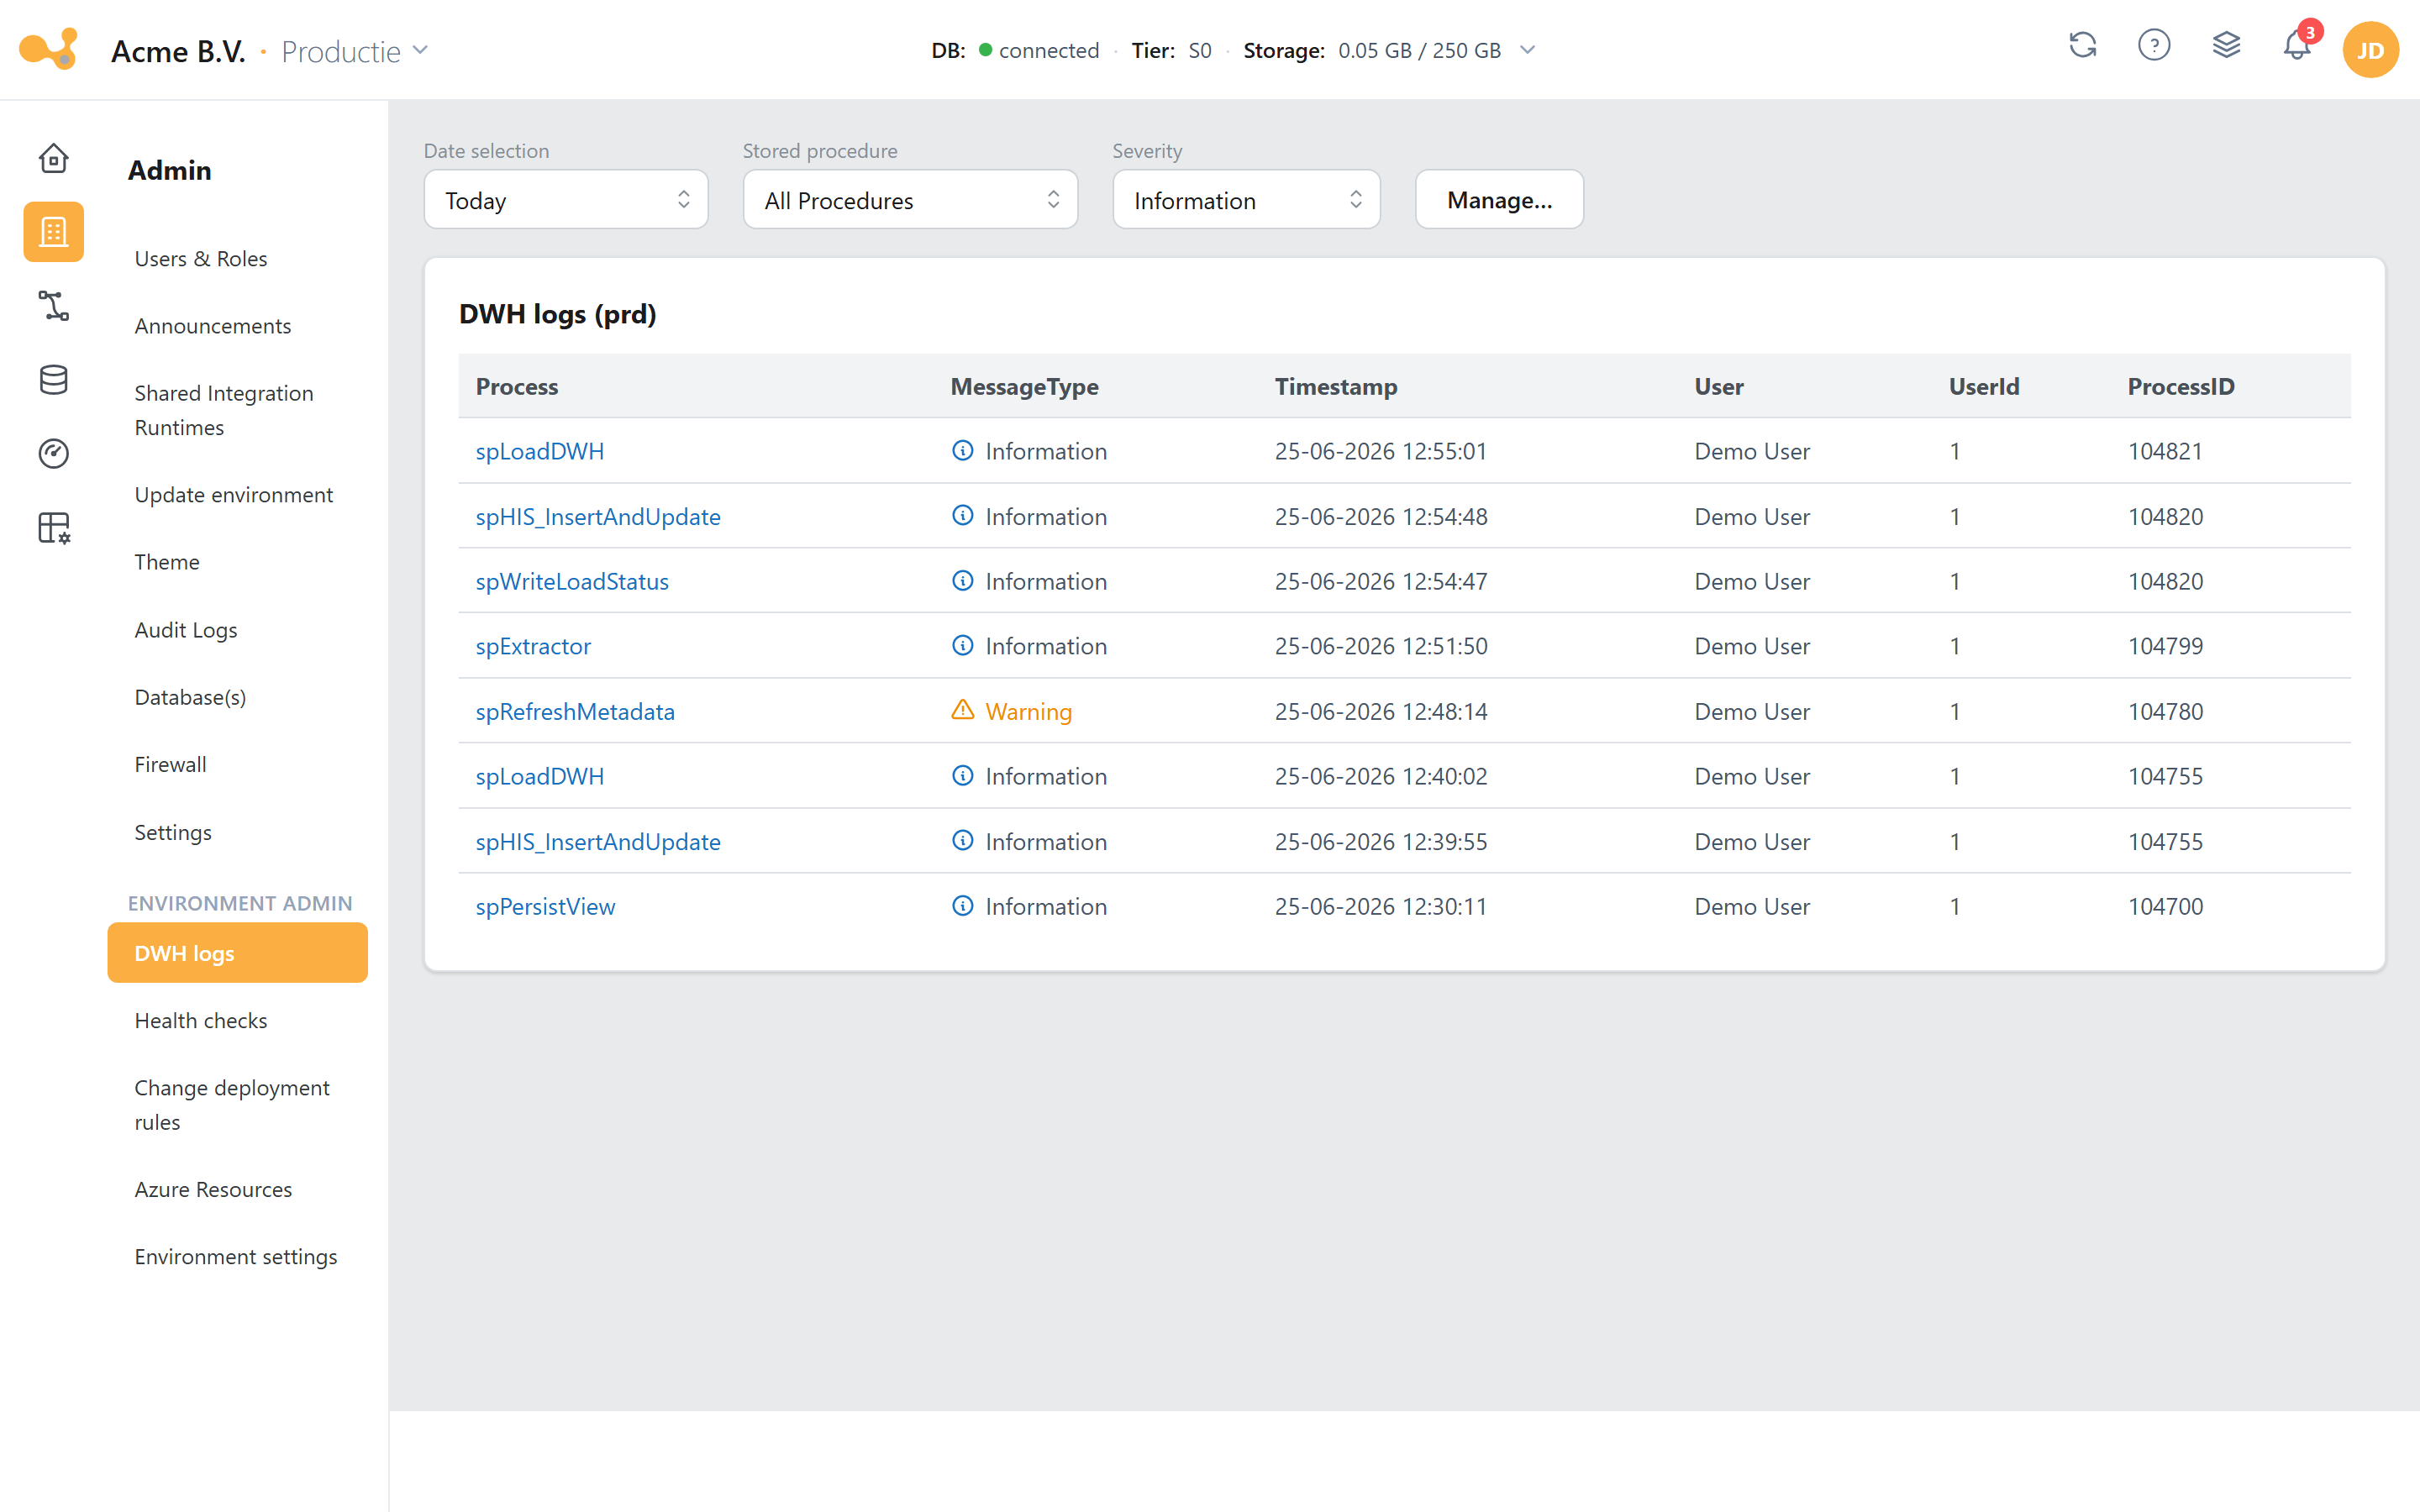
The DWH logs page reads Config.ProcessLog; filter by date, procedure and log level, and open the steps per row.
- Date filter — limit the log lines to a date range.
- Proc and log-level filters — filter by a specific procedure and by level (Information / Warning / Error), with an "equal and worse" option.
- Clear count — reset the error counter (badge).
- Info — opens the steps modal for that log line.
- Failed step + ADF link — the modal shows the steps and the error message; on load failures you can click through to ADF.
The DWH logs page is bound to an environment (e.g. Production) and is not available on Development.
Investigating a failed load
Follow these steps when a load fails:
- Open Load management → Monitoring and select the relevant target in the Targets tree (the FAILED status is marked red).
- In the runs grid, click the info icon of the failed run to open the steps modal. There you see which step failed (e.g. Load DWH /
spHIS_InsertAndUpdate) plus the error message and the Link to ADF. - Use the ADF link to open the underlying pipeline run in Azure Data Factory for the full error trace.
- For proc-level detail: open Admin → DWH logs, filter by the procedure involved and by log level Error, and open the steps modal for the exact message.
- Resolve the cause (e.g. a timeout → scale up the database tier or reduce
PageSize) and start the load again via Run pipelines.
The same can be queried via a SQL endpoint: SELECT * FROM [Monitoring].[vwLoads] WHERE [Status] = 'FAILED' ORDER BY [DateTime] DESC for the failed runs, and SELECT * FROM [Config].[vwUserlog] WHERE MessageType = 8 for the associated error messages.
Further reading
- Logs & views — all log tables and views with their full output columns.
- SQL Interaction — the catalog of procedures, functions and views.
- Data flow — the load chain these log lines stem from.
- History & SCD2 and Load types — what the row counts (New / Delta / Closed) mean.
- Troubleshooting — common errors and solutions.